


Understanding Hot Products
What are the top 50 most likley products to generate retail loss?
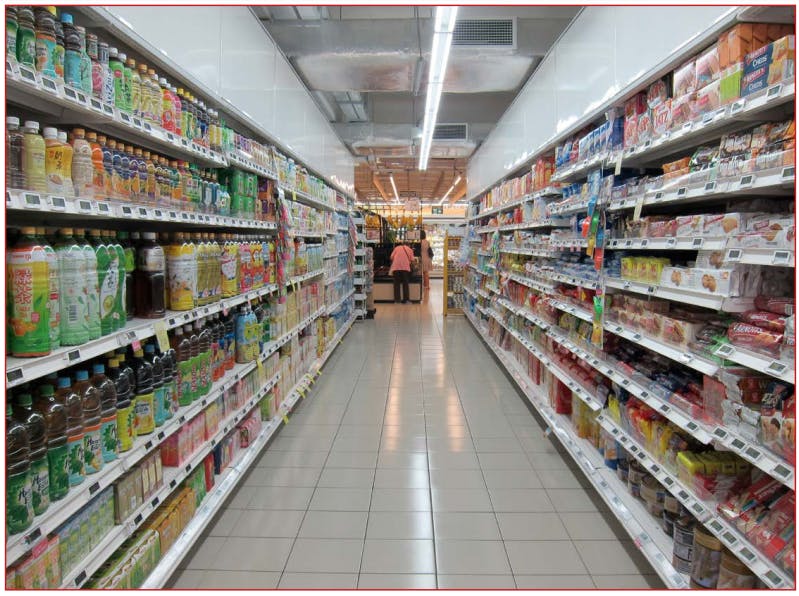
This report, which was published in 2010, presents data on the grocery products that suffer disproportionally high level of shrinkage. It focusses upon three categories: Food; Health and Beauty (H&B); and Beers, Wines and Spirits (BWS).
It is based upon data collected from three companies operating in the UK, focussing upon the top 50 items in each category over a 12-month period (by value and percentage of total sales). It adopts a novel methodology to allow data to be combined from companies with very different levels of turnover: generating a product risk score based upon its multiple of the overall average and its percentage of total variance.
The study is very much focussed upon describing the ‘what’ rather than the ‘why’ of hot products – it does not offer any detailed discussion on the reasons for particular types of products having a higher risk score than others.
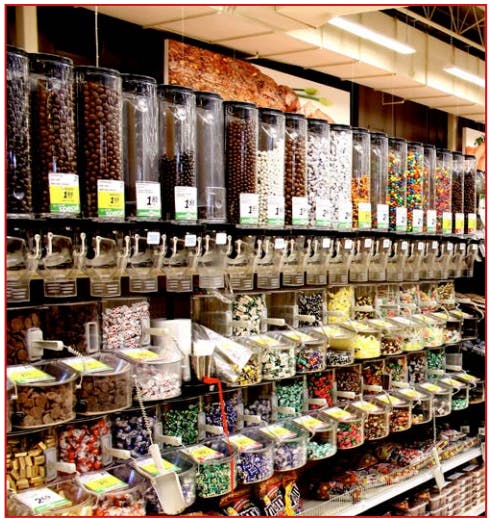
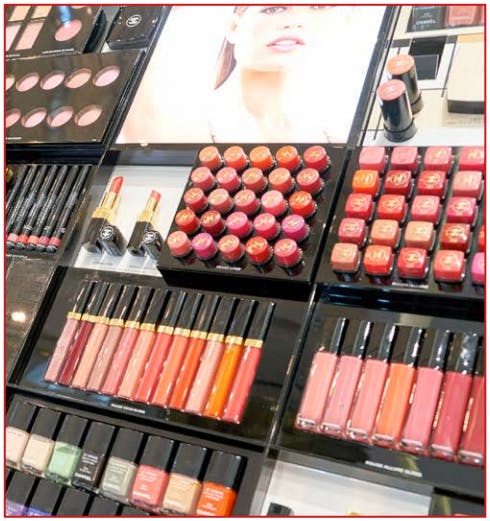
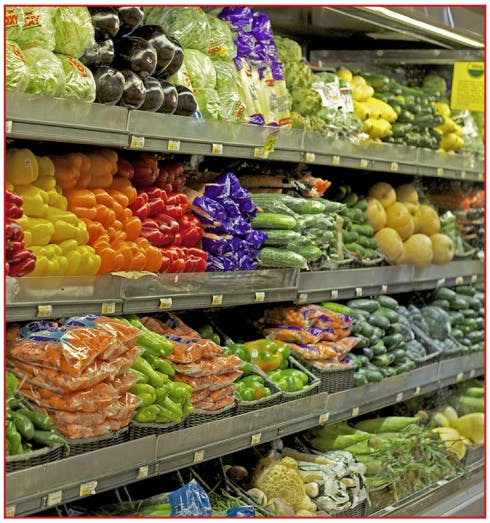
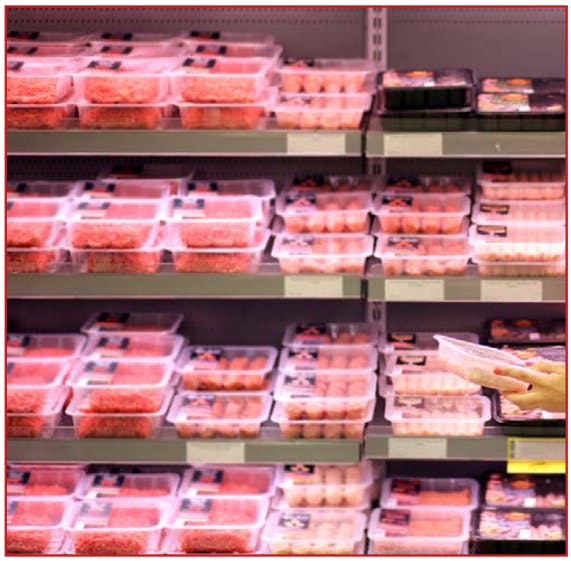
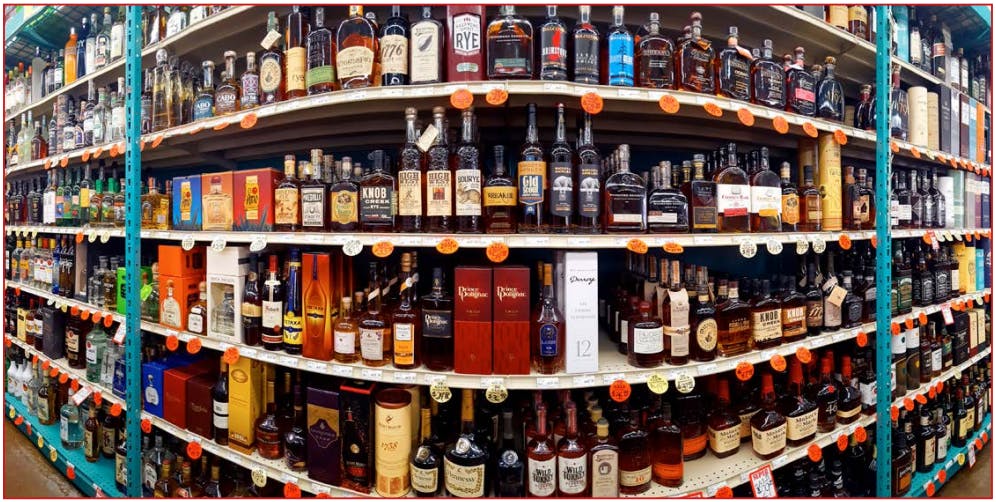
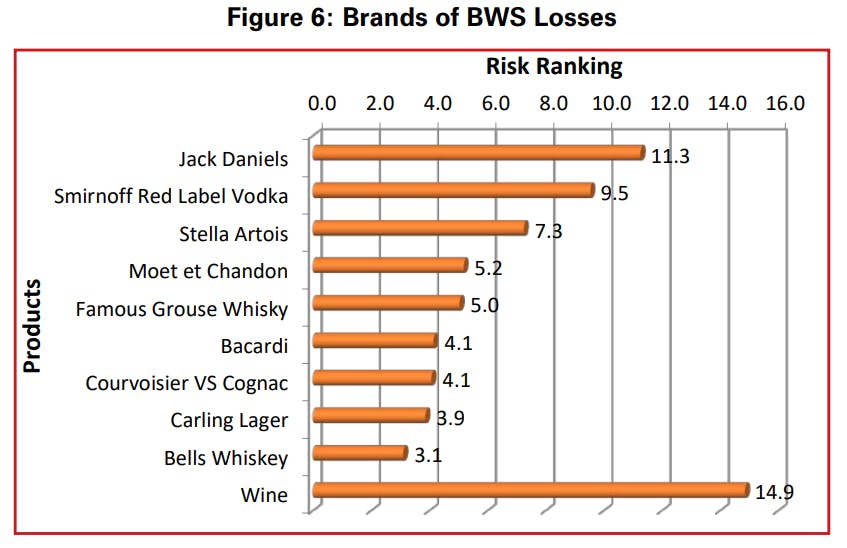
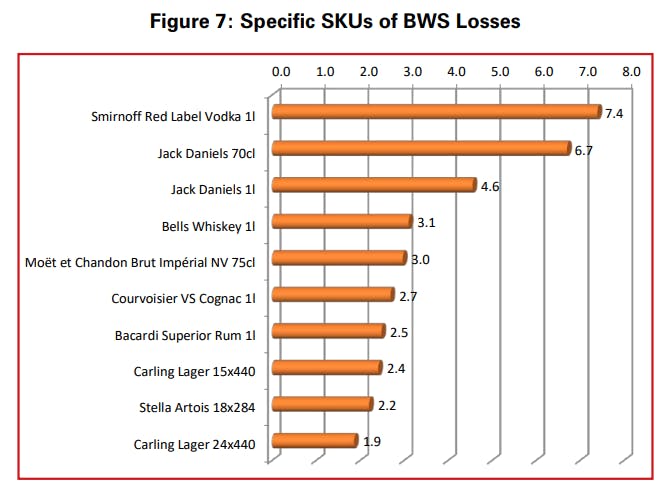
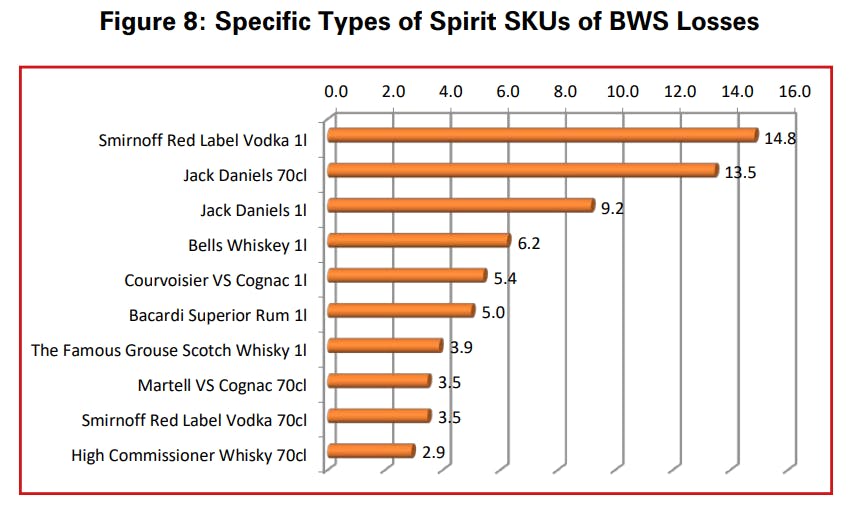
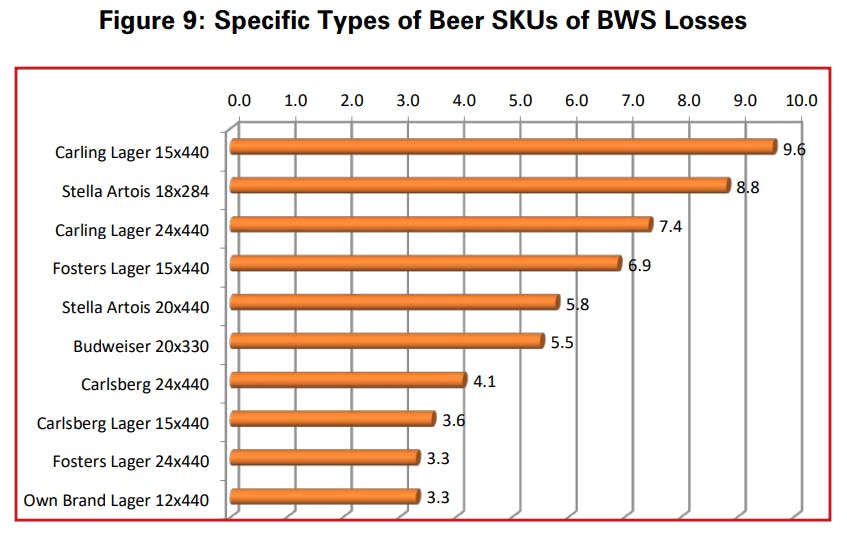
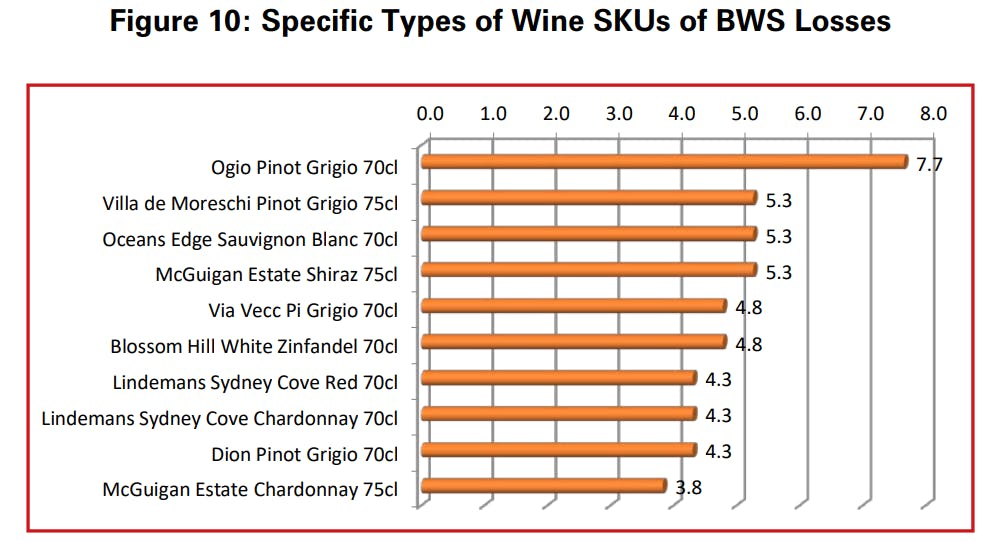
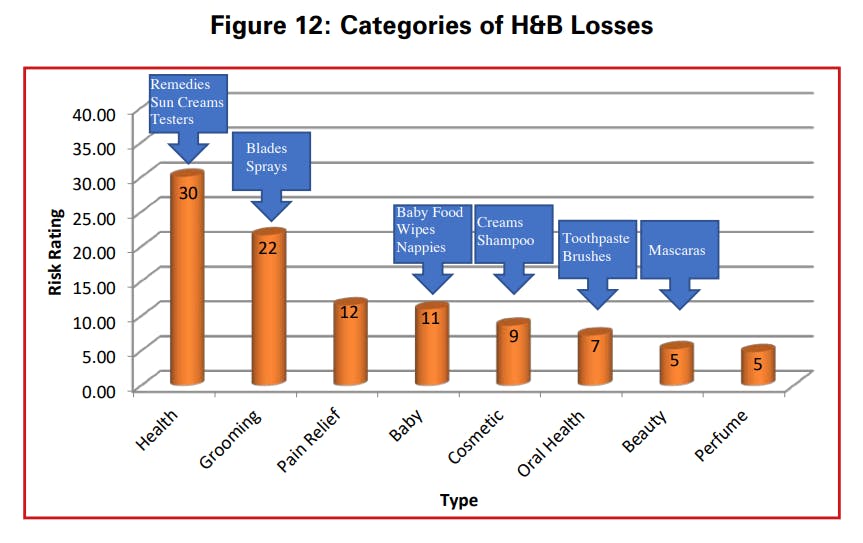
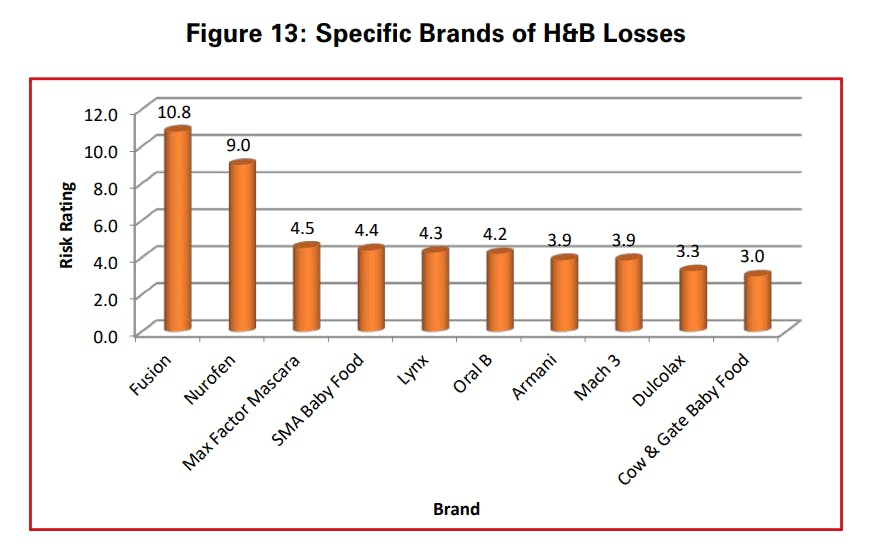
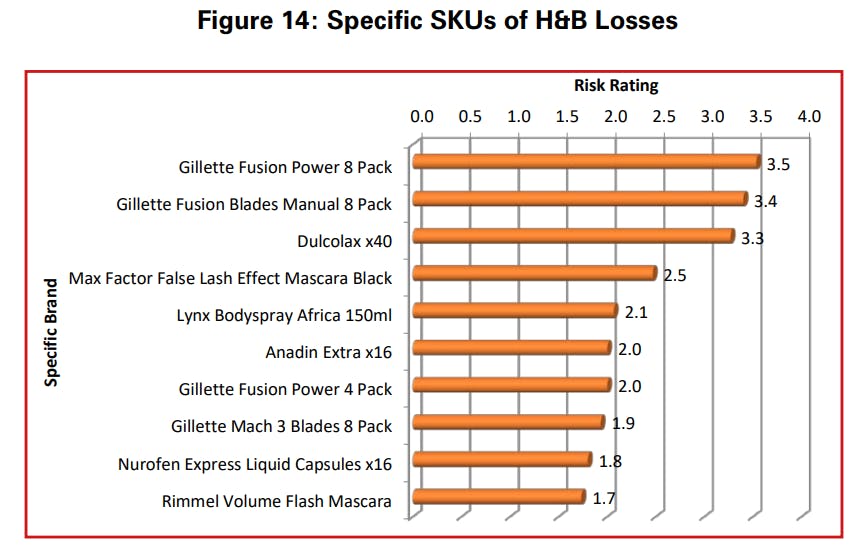
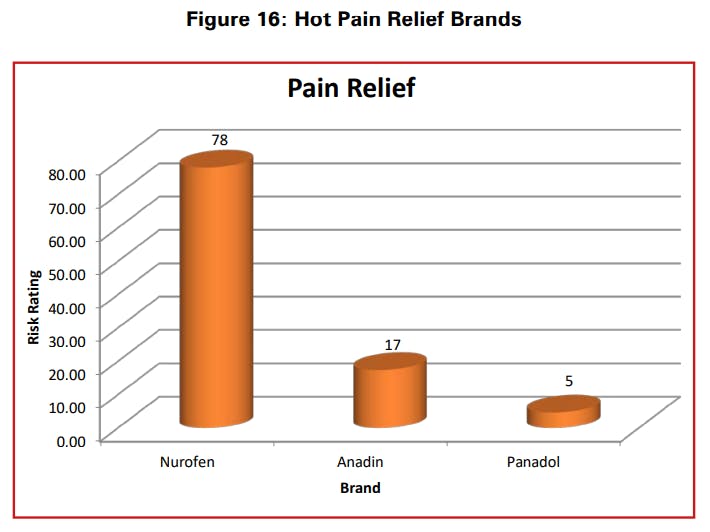
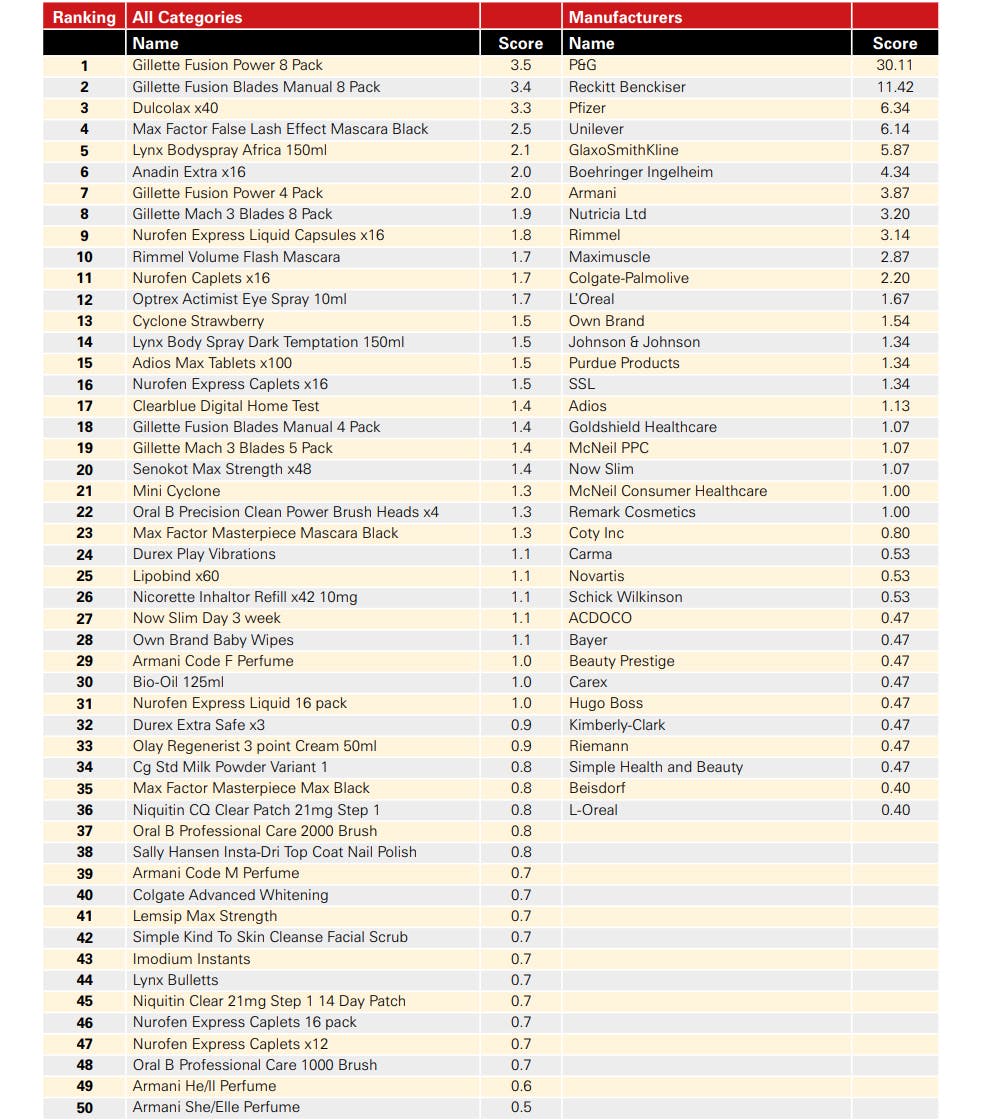
Within categories, the study found that fresh meat was by far and away the biggest area of concern, particularly beef. For BWS, some key brands dominated the lists, not least Smirnoff Red Label Vodka and Jack Daniels. Perhaps of equal interest is the preponderance of beer and wine categories within the top 50, both of which rarely feature in traditional high-risk lists. The study suggests that these losses are not due to customer theft but are more likely to be associated with the way in which these types of products are processed within retail businesses. Within H&B products, the study noted the prominence of high value razor blades and pain relief products.
The study also noted that despite some of the products in these lists being the subject of considerable efforts to protect them on the shelf (such as the use of tagging, safer cases and so on) it would seem that the results are rather limited. It suggests that new thinking may be required for some of these products and the active involvement of all parties in the retail industry is far more likely to generate meaningful results than individual companies acting in isolation. It also points to the value of retailers coming together to share data to enable them to begin to develop strategies to deal with common problems.
Finally, the report argues that the data provides an opportunity for greater engagement and dialogue between manufacturers and retailers, something which has been highlighted in many other ECR studies.
Background
Research by the ECR Europe Shrinkage Group and others has frequently highlighted the relative risk of shrinkage to particular types of products – what are usually described as the ‘hot products’ in the retail sector. For instance, a study by Beck and Chapman presented data on the vulnerability to shrinkage of one company’s range of products, which showed that 8 per cent of Stock Keeping Units (SKUs) were responsible for 30 per cent of all shrinkage losses, while 20 per cent of products accounted for one half of all losses1 . For the most part the identification of the products most at risk has been through shrinkage surveys where respondents are asked, based upon their perceptions, to suggest those items that are most likely to suffer from shrinkage. Inevitably, such an approach tends to produce relatively generalised lists focussing more upon categories of products rather than specific items and usually focuses upon those most likely to be stolen.
For instance, the recent Global Retail Theft Barometer summarises the products that are deemed by respondents to be the most likely to be stolen and found that razor blades/shaving products and cosmetics/face creams were at the top of the list, followed by perfumes, alcohol, fresh meat and expensive foodstuffs, infant formula and DVDs and CDs2 . Further down the list are to be found small electrical items and fashion clothing. The survey undertaken by the Food Marketing Institute offers a slightly different ‘top five’ stolen items: meat, health and beauty care items, analgesics, baby formula and then razor blades3 . However, much of this data is problematic as it is simply based upon what respondents think are the items most likely to suffer from shrinkage rather than what is actually lost. While these opinions may be based upon personal reflections on data available from within their own organisations, they can also be a result of commonly held views about the items traditionally viewed as prone to shrinkage4 . In other words they are rarely based upon an actual analysis of shrinkage data and they certainly do not do this across different retailers.
Being able to identify the products most likely to suffer from shrinkage is vitally important to the retail industry – resources available to tackle the problem are finite and therefore companies need to be able to channel their efforts on those products that are most likely to suffer from shrinkage – the vital few rather than the trivial many. There is also evidence to suggest that by adopting this approach organisations are more likely to see quick and highly tangible results from their work and to experience ‘benefits of diffusion’, where the approaches adopted to make the hottest products less likely to suffer shrinkage also benefits those that are less risky but also vulnerable to the same problem.
There is also plenty of work that has been undertaken on trying to understand what it is about certain products that make them more likely to suffer from shrinkage. For instance, Clarke developed the acronym CRAVED to describe the characteristics of hot products (in this case those most likely to be stolen)5 . His suggested that ‘hot products’ had a number of characteristics that made them much more liable to be stolen; they were: Concealable (easy to hide when being stolen); Removable (easy to remove); Available (easily accessible); Valuable (either personally to the thief or to others who may wish to purchase it); Enjoyable (generally the product is enjoyable to own or consume); and Disposable (a ready market for the stolen item exists). Of these factors, Clarke suggested that the ability to dispose of the stolen goods easily was the critical variable in explaining why some goods are more likely to be stolen than others. Similarly Gill et al. have gone on to explore in more detail the way in which the value or worth of a product impacts upon its likelihood to be stolen and coined the acronym AT CUT PRICES to try and explain these characteristics6 . The 11 factors were considered to be: Affordable (could be purchased with available cash); Transportable (easy to move around); Concealable (easy to hide); Untraceable (have few auditable markings); Tradeable (can be exchanged for other things as well as cash); Profitable and Reputable (well known brand); Imperishable (long life span); Consumable (needs regular replacement); Evaluable (quality can be verified); and Shiftable (good regular market for the items).
While both these studies have helped shaped our understanding of why certain products are more likely to suffer from shrinkage, they are almost exclusively focus upon malicious shrinkage, in particular customer theft. But there are also products which suffer high levels of shrinkage that are not necessarily stolen – non malicious shrinkage – such as those that are damaged, go out of date and so on (frequently described as process-failure related). It has been suggested that this is potentially a much bigger problem than malicious forms of shrinkage. For instance, research has estimated that 10 per cent of all perishable goods are rendered unusable before they reach the consumer and that inventory write offs in the global retail industry from spoilage and obsolescence amounts to $120 billion7 . The Food Marketing Institute survey (2007) also offers some insight in to this matter. They asked respondents to calculate what percentage of inter-store departmental turnover was accounted for by shrinkage. While the overall shrinkage figure for the sample was 1.52 per cent, Bakery Departments had an average rate of 10.39 per cent and Delicatessen Counters averaged 10.36 per cent – the former being 584 per cent above the overall average and the latter 582 per cent8 .
This growing recognition of the extent of nonmalicious shrinkage has led some researchers to look at the types of products most likely to suffer shrinkage in this category and why it may be happening. Beck and Peacock developed the acronym SERV to describe the characteristics of non-malicious hot products: (S) sensitivity to time (products with a finite shelf life), (E) expectations of consumers (any faults in the packaging will minimise sales); (R) reprocessing (shrinkage caused when raw products are reprocessed in-store), and (V) vulnerability of packaging (shrinkage caused by damage to the product)9 .
Purpose of Study
This study is the first attempt to delve much deeper into the actual products that suffer disproportionally high levels of shrinkage – the real ‘hot’ products. It is not based upon perception data but on actual shrinkage data from retailers. As such, this is a ground-breaking study and offers retailers and manufacturers new insights into those products that are most vulnerable to shrinkage. This has not been easy (as will be highlighted below) as each company tends to adopt slightly different ways of measuring and recording shrinkage in their business and hence developing a composite hot list has proven to be fraught with complications. Hence it makes use of a relatively limited data set (just three companies from the Fast Moving Consumer Goods sector in the UK and only looking at three categories of product – Food, Health and Beauty, and Beers, Wines and Spirits) and so readers need to be cautious in how they interpret and use this data. However, it contains some fascinating insights into those products that are most vulnerable to loss. At this stage it has not been possible to go beyond simply presenting a description of the data – this report describes the what but not the why. This is likely to be the focus of future work but it was thought important to publish this data in its present format to better inform the retail community about those items that are currently most vulnerable to shrinkage in this particular geographical location and retail segment.
Methodology
As detailed above, getting comparable shrinkage data from retailers is not easy, not least because it is frequently deemed highly sensitive information and not something that is often shared with third parties. The researcher is extremely grateful to those companies that agreed to participate in this work and to openly share this information. It is also difficult because most retail companies have their own ways of recording and measuring shrinkage and indeed the way in which particular products are assigned and described in their information systems. Trying to bring these disparate data sets into a single coherent list is therefore fraught with complications and compatibility issues.
It is important therefore to describe the characteristics of this data set and how it was generated, and how it was used to develop the hot products lists detailed below. In the first instance, discussions were held within the ECR Europe Shrinkage Group to decide what would be a practicable data request to retail companies – what would be likely to be available and what sorts of product ranges should be requested. It was decided to focus upon just three types of products: Food, Health and Beauty (H&B), and Beers, Wines and Spirits (BWS). The reason for this was twofold. First, given that this was the first attempt to do this it was thought important to keep the project highly focussed (many FMCG retailers have over 20,000 separate SKUs, with some having as many as 200,000). Secondly, these three ranges were deemed to be of particular interest (Food to highlight non malicious shrinkage and H&B and BWS because they are traditionally viewed as categories likely to suffer from high levels of malicious shrinkage). It was then decided that retailers would be requested to provide the total amount of known and unknown shrinkage (value and percentage of total sales) for the past 12 months for the top 50 items in each of these categories. Respondents would be reassured that the data would be held securely and confidentially by the University of Leicester and only composite data would eventually be published.
This request for data was then sent out to all retail members of the ECR Shrinkage Group. Subsequently eight responses were received: one did not collate data in a way that was compatible with this request; one did not collect any data at SKU level; one could only provide a composite list spanning two of the three categories; one could only provide a composite list of all three categories; four could provide this data but with varying degrees of specificity (some could not/would not provide known shrinkage data, others could not provide shrinkage as a percentage of total sales etc). Eventually, through a reductionist process it was decided to focus upon just three companies based upon unknown losses only using the total value lost for separate SKUs. These three companies were in the UK and were some of the largest in the supermarket sector. Collectively they represent 41 per cent of the market with a combined sales turnover of €110 billion. The data they made available represented losses of €72 million, which covered only the top 50 shrinkage items for each company from the calendar year 2009.
The next step was to make the lists compatible with the degree of specificity dictated by the lowest common denominator available amongst the three companies. For instance, if the quantity for a given product was not available in all three companies, then a more generalised description of the product had to be used. In addition, further research was undertaken to identify the manufacturers of the products from the descriptions made available by the retailers – again this was not easy as the actual origin of particular products can be difficult to ascertain. Contacts were made within the industry to do this work but it is recognised that there may be errors and the author welcomes any feedback on this to improve the accuracy of this aspect of the data set.
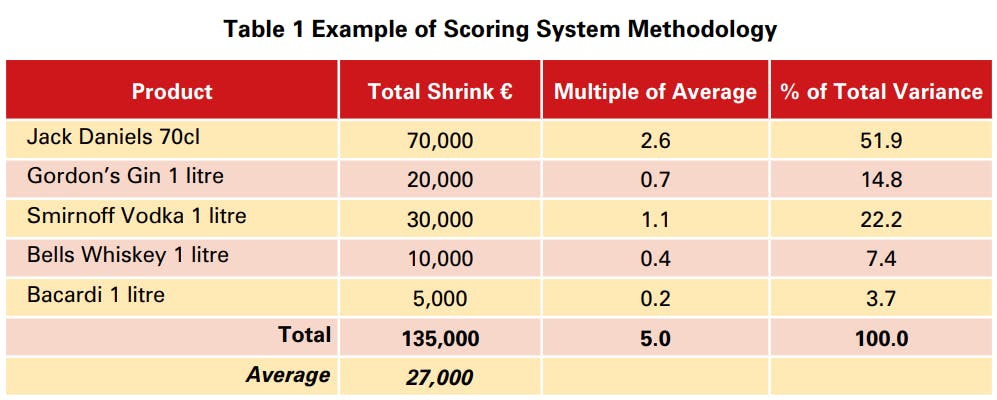
Once the data had been thoroughly cleaned and comparable data descriptions had been agreed upon for the three companies, the next step was create a means by which the top 50 lists could be produced. Because the turnover in each of the companies was vastly different it was not possibly to simply combine the total amount lost per SKU – inevitably the company with the largest turnover and hence largest shrinkage figures would have dominated such a list. Therefore, before the lists were combined each product was given a risk score based upon the variance from the average shrinkage figure for a given retailer. So for instance, if a product was twice the average loss, then it received a score of two and so on. Once this was done, the lists were combined and each category was then ranked based upon the percentage of the total variance it represented. So for instance, if a product scored 5 and the total variance was 10, then it received a risk score of 50 per cent. Table 1 below offers a worked example of this methodology.
Note of Caution
Using this methodology, the percentage of total variance is used to generate what we have described as the ‘risk factor’ for the various categories and types of products presented below.
It is very important to recognise the limited nature of the data presented. It only represents three retailers in the UK and only those operating in the supermarket arena. It also only focuses upon just three categories of loss: Food, Health and Beauty and Beers, Wines and Spirits and only the unknown losses for these categories of product. The reasons for these losses, by definition, are unknown: they could be due to internal and external theft, process failures and indeed inter-company fraud. This report does not try to set out to explain why these losses occurred and merely presents the data from these three companies. Clearly further and more detailed work is required to begin to ascertain why certain categories and types of product appear at the top of these lists and the ECR Shrinkage Group would like to take this work forward in the future. It would also be useful to repeat this exercise not only for different types of categories of product but also in different countries as the landscape of losses is highly likely to be very different. The reader is therefore encouraged to read this data with these notes of caution in mind and to reflect upon the results with an open mind. The ECR Europe Shrinkage Group would welcome feedback on this work and suggestions for directions for future work in this area.
In the next section the data for the hot products identified is presented without commentary focussing upon, where appropriate, the top 10 items from the top 50 lists. This is done to aid presentation and interpretation but more complete data is provided in Appendix 1 in the form of data tables showing the top 50 items or less depending upon the number of discrete items identified in the data.
Findings
Cross Category Comparisons
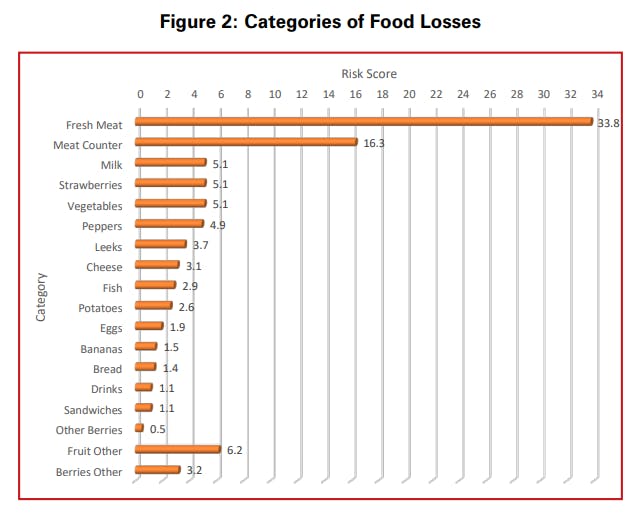
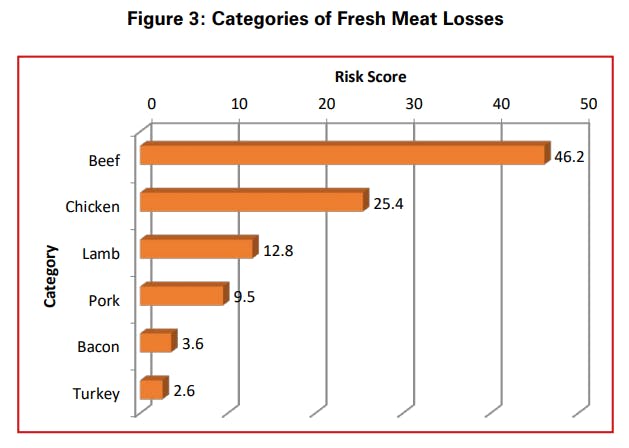
Food
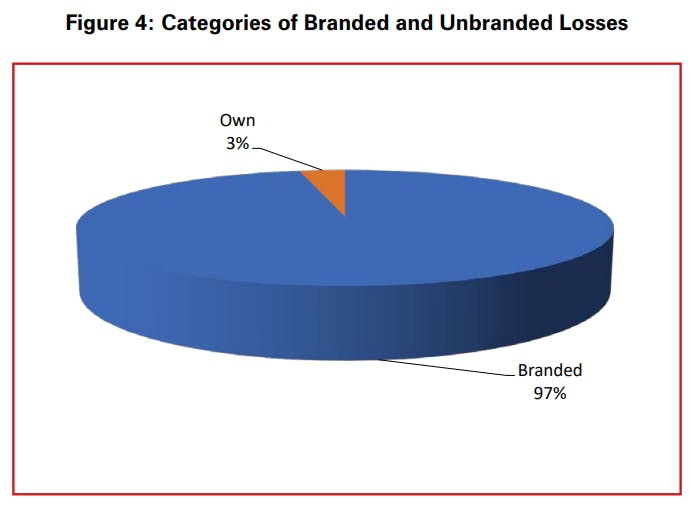
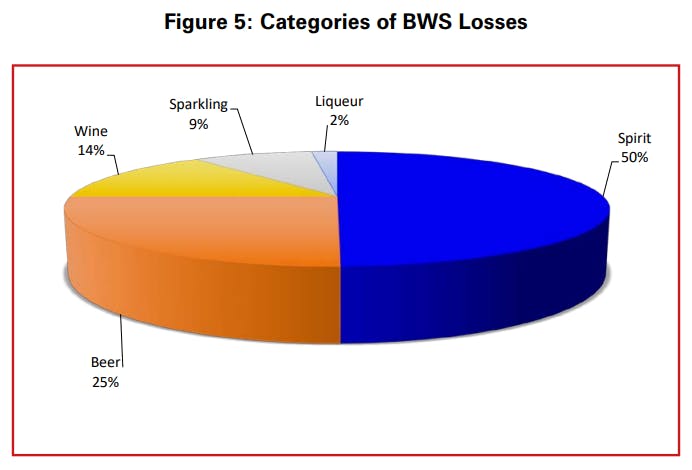
Beers, Wines and Spirits
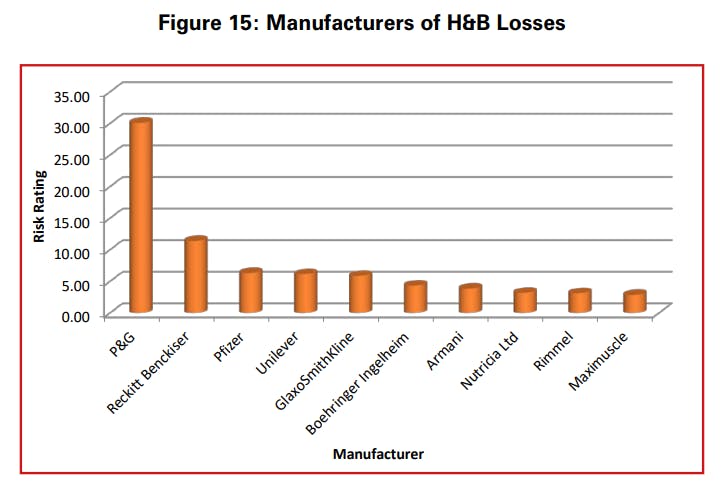
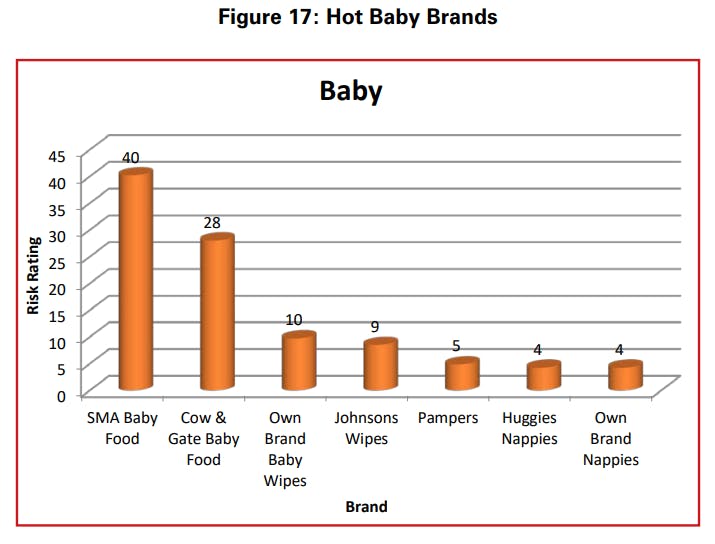
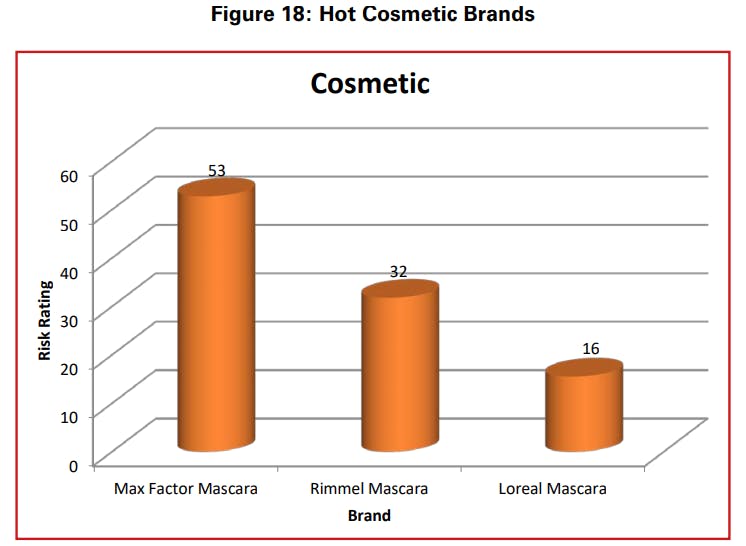
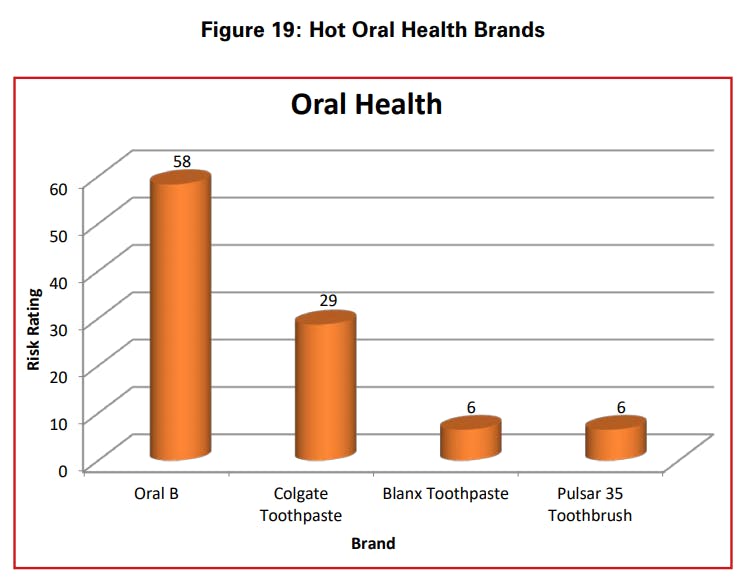
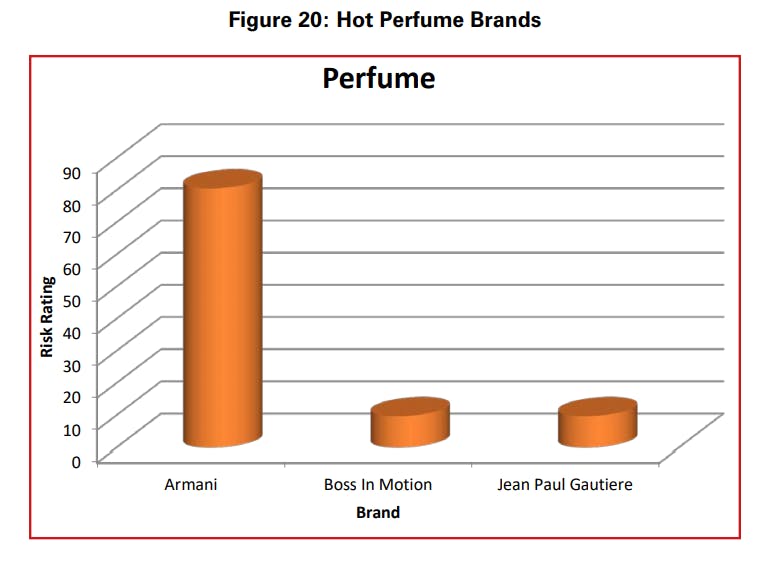
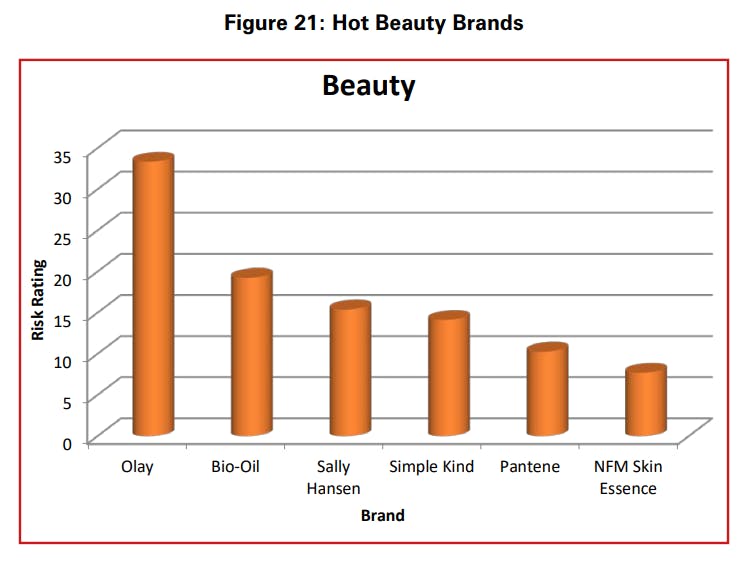
Health and Beauty
Conclusions
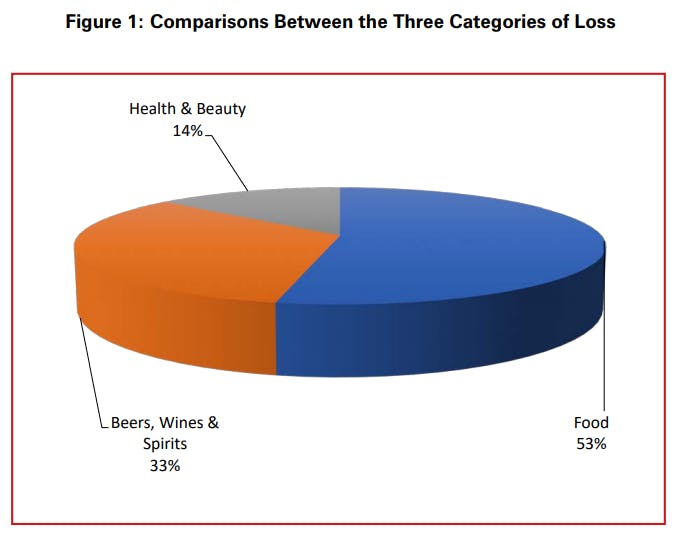
The purpose of this report has been to present the findings from a study undertaken by the ECR Europe Shrinkage Group on identifying the hottest products within very specific categories of products. As detailed at the start of this report, the data needs to be treated with caution – the applicability of results beyond the UK supermarket sector is very limited. However, it has revealed some fascinating results, not least the dominance of food compared with the other two categories of products – 50% of all losses. This is surprising in that H&B and BWS tend to dominate the shrinkage agenda, with both frequently seen as areas of major concern. This data does not necessarily suggest that they are not, but the dominance of Food as an area of unknown loss certainly puts their overall riskiness in perspective.
Within categories, fresh meat was by far and away the biggest area of concern, particularly beef, and this raises a whole host of questions about why this is the case. For BWS, some key brands dominated the lists, not least Smirnoff Red Label Vodka and Jack Daniels, which were largely expected. Perhaps of equal interest is the preponderance of beer and wine categories within the top 50, both of which rarely feature in traditional high risk lists. Initial reactions suggest that these losses are not due to customer theft but are more likely to be associated with the way in which these types of products are processed within retail businesses. Both are regularly subject to price changes and promotional activities and these losses are likely to be explained more by process errors rather than malicious forms of activity. Finally, within H&B the prominence of high value razor blades was perhaps to be expected but the high rating for pain relief products would perhaps come as a surprise to many and suggests a potentially new headache for loss prevention practitioners.
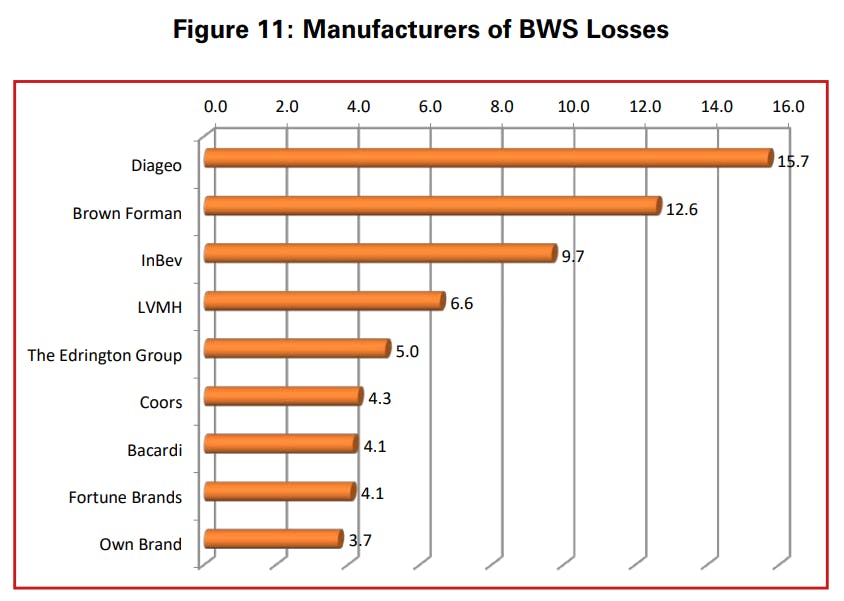
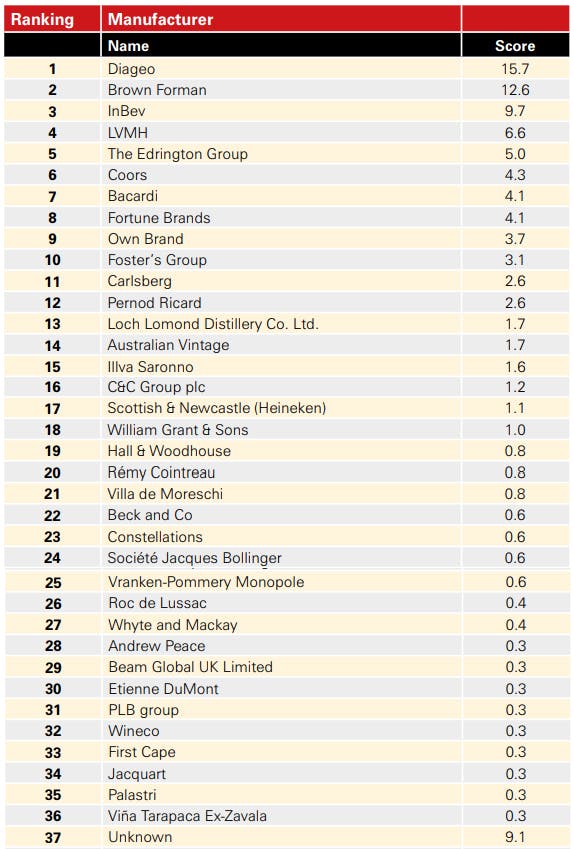
This data provides an opportunity for greater engagement between manufacturers and retailers. This is the first time that this type of data has been made available and it has identified some very clear brands that feature highly across all companies. It also highlights the manufacturers of these brands and it is hoped that the report will instigate greater dialogue between them and their retail customers. Other work by the ECR Europe Shrinkage Group has emphasised the need for greater collaboration between these two groups if lasting solutions are to be found to the root causes of shrinkage on hot products.
Of particular interest here is that despite some of the products in these lists being the subject of considerable efforts to protect them on the shelf (such as the use of tagging, safer cases and so on) it would seem that the results are rather limited. It suggests that new thinking may be required for some of these products and the active involvement of all parties in the retail industry is far more likely to generate meaningful results than individual companies acting in isolation It also points to the value of retailers coming together to share data to enable them to begin to develop strategies to deal with common problems.
Appendix 1: Detailed Hot Product Lists
Additional data is only provided in this section if it was available and was not presented earlier in the report.
Beer, Wines and Spirits
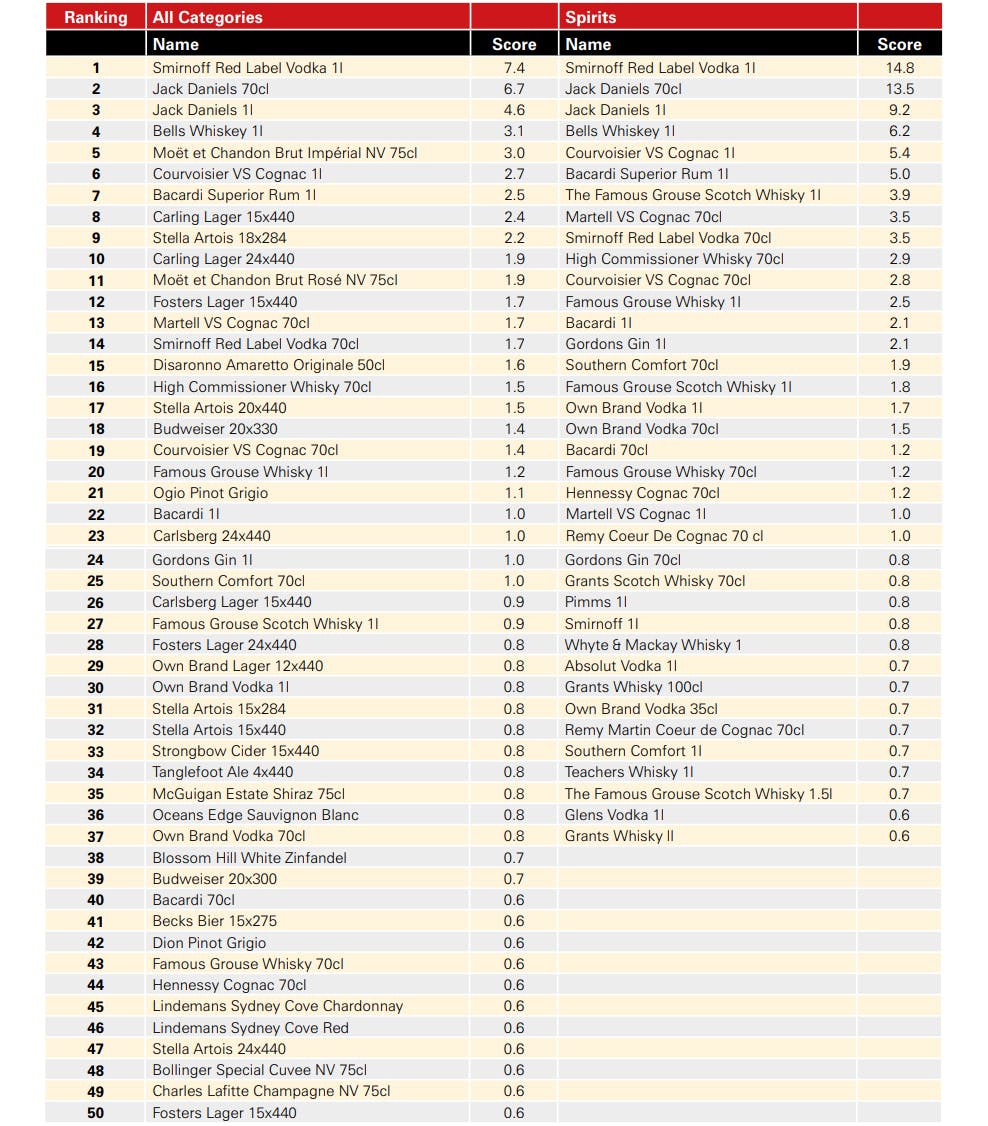
Beer, Wines and Spirits
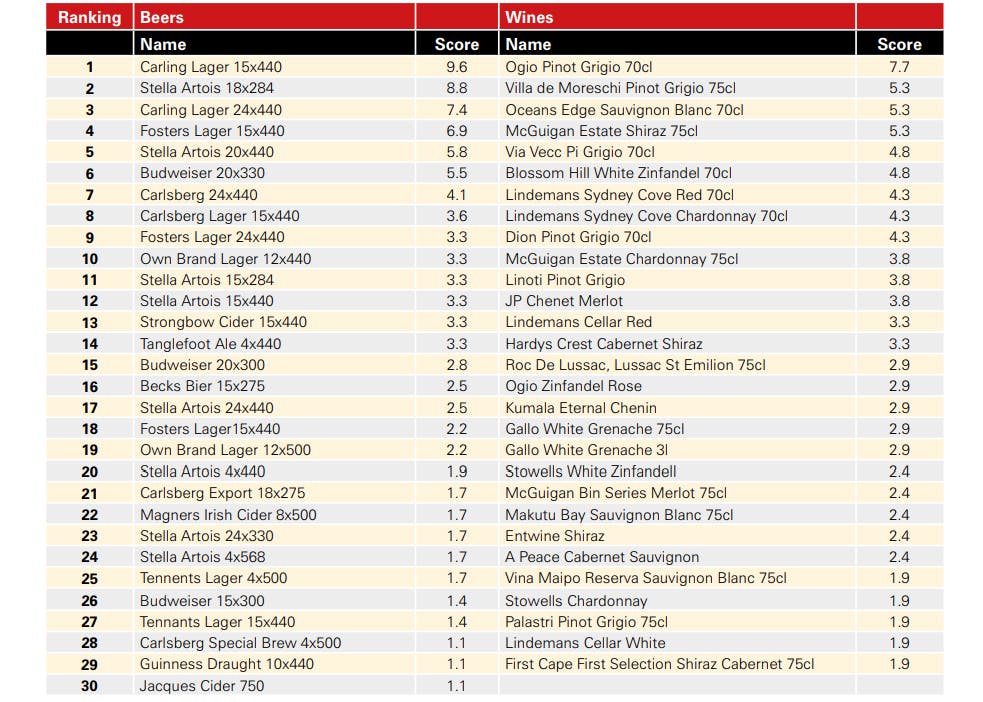
Beer, Wines and Spirits
Health and Beauty


Main office
ECR Community a.s.b.l
Upcoming Meetings
Join Our Mailing List
Subscribe© 2023 ECR Retails Loss. All Rights Reserved|Privacy Policy