


The Utilisation of Video Analytics: A Survey of Retailers
How retailers are using and planning to use video analytics
Table of Contents:
- Defining A Video Analytic
- Survey Methodology
- Overall Utilisation of Video Analytics
- Top Five Video Analytics
- Use of Video Analytics by Retail Location
- Current Utilisation – Limited and Focussed
- Characteristics of Successful Video Analytics – Binary Clarity
- Impact of Operating Complexity
- The False Positive Consequence Continuum
- Video Analytics – Offering Deliverables not Distractions
- Types of Video Analytics
Languages :
This report, published in 2022, provides a summary of a survey focussed upon understanding which of 47 pre-defined video analytics retailers were either currently deploying or planning to deploy soon. The results are based upon responses from 81 retailers from 20 countries – Europe (47), North America (28), Australia (5), Middle East (1). They were mainly large retailers with a combined turnover of just over €2 trillion, equating to approximately 12% of the global retail market. The majority were from the Grocery sector (60%).
The survey found that the adoption of video analytics is currently very low – an overall utilisation rate of just 7%. However, the data also identified a clear trend towards significant future interest in and use of video analytics – it would seem to be an area on the cusp of much greater utilisation across a range of retail settings. In particular, areas around the retail store checkout and in the aisles seem to be areas of considerable testing and future development. Moreover, for Grocer retailers in particular, the interest in video analytics seems particularly pronounced, driven in large part by their growing concerns around the use and control of self-scan technologies. The data suggests that video technologies in general, and video analytics in particular, could be one of the major growth areas in retail technologies in the near future.
Introduction
The use of video technologies and in particular, ‘video analytics’ is growing considerably across the retail industry. The recent ECR Retail Loss Group report on this topic summarised the various ways in which video systems were deployed and for what reasons, including a few examples of video analytics that were being used or trialled. These spanned both security and non-security settings including burglar alarm monitoring and staff member not present scenarios. To more fully understand the types of video analytics that retailers are now beginning to test and deploy, the ECR Retail Loss Group decided to undertake a short survey of retailers to better understand the scale and extent of their use. The results from that survey are presented in this short report.
Defining A Video Analytic
The move from analogue to digital video systems brought about a profound change in the way in which these technologies could be utilised. In effect they went from very ‘dumb’ systems – merely recording ‘images’ that could be viewed in real time or later, to ones that were ‘smart’, generating ‘data’ that could be searched and analysed in ways that were simply not possible with an analogue system.
When it comes to defining what is meant by the term ‘video analytic’, currently there is no clear-cut definition and there are areas of ambiguity within the industry. The following discussion is an attempt to begin to try and draw out what a workable definition might be. A good starting point is the following: ‘the capacity of computers to automatically interpret digital images to provide insights of value to the user’1 . There are three elements to note here, first, the process is done by computers, secondly it is done automatically – no human input is required, and thirdly, it provides valuable insights. While the first two elements are relatively straightforward to understand and agree, the third element is perhaps overly broad – arguably, any video footage in the right circumstances could provide insights that are of value.
When reviewing the range of ‘analytics’ currently in the marketplace, what seems clear is that they are largely designed to either generate an alert when something happens outside of an agreed parameter, or they enable an action to proceed if an agreed parameter has been met. So, for example, a person is ‘identified’ entering a restricted area and the system sends an alert to a designated guardian. A product is ‘identified’ that has not been registered by a shopper on a self-checkout till and an alert is generated. A fire exit door is opened when a fire alarm has not been activated and an alert is sent to a designated guardian. A member of staff is allowed to enter a restricted space through a system recognising their face. A truck is allowed to enter a distribution centre because its vehicle licence plate is recognised as being on an approved list. These would all seem to be examples of where the purpose of the video analytic has been clearly defined and there is evidence of an actionable, often real time outcome that brings tangible benefits to the user.
So far so straightforward, but what about a system which, for instance, counts the number of people in a defined area, or only records video images when there is any form of movement within the field of view of the camera to preserve storage space? Are these forms of video analytics as well? I would argue that the former could be, while the latter is probably not. If the purpose of counting people within a given area is for a clearly defined and actionable purpose, then it is a video analytic. For example, if the system is counting people entering a store in order to trigger an alert to make a certain number of checkouts or checkout staff available to reduce queue times in the near future, that would be a analytic. Equally, if monitoring the number of people in a store was used to control how many more could enter (such as the traffic light system used in the COVID Pandemic period), then that also would be as a video analytic. However, if the system is simply counting the number of people purely for footfall analysis at a later date, then that is arguably not a video analytic but more a routine (video) data collection exercise, not dissimilar to data collected from say point-of-sale systems.
Let’s now look at the second example – a system designed to only store video images when there is movement within the field of view of the camera to save on storage space. I would argue that this is not a video analytic but instead an example of a ‘smart’ video optimisation system. It likely meets the first two criteria of the video analytic definition described above (automatic and computerised) but there is much less evidence to say that it is generating clearly defined actionable outcomes. That’s not to say that it is not an extremely helpful tool for saving space and time, but it is arguable whether it is a video analytic.
Given all of that, perhaps a ‘work in progress’ definition of a video analytic might be:
A video system that uses the capacity of computers to automatically interpret digital images in order to generate clearly defined and actionable outcomes.
Survey Methodology
As with most of the surveys carried out on the retail industry, they are largely based upon data provided by the willing – getting a representative sample can be very challenging, especially when the survey is interested in what might regarded as ‘company sensitive’ information. The ECR Retail Loss Group has now built up a strong reputation within the global retail community for undertaking independent and useful research across a wide range of topics and making the results freely available to all. As such, it can often call upon its ‘affiliates’ to participate in new research and the current study is no exception. The purpose of the study was very straightforward – understand which of 47 predefined video analytics were retailers either currently deploying or planning to deploy soon. These 47 analytics were grouped in to six discrete parts of the retail supply chain:
- Store Environment 5 Analytics
- Store Entrance 4 Analytics
- Shopfloor 12 Analytics
- Checkout 9 Analytics
- Store Backroom 7 Analytics
- Retail Distribution 10 Analytics
A full list of each of the Video Analytics used in this survey is available in Appendix 1. For each analytic respondents were asked to score them using a 5-point scale:
- Not Using
- Plan to Trial/Use in the Next 12 months
- Currently Trialling in a Few Stores
- Partially Deployed (less than 50% of all locations)
- Fully Deployed (more than 50% of all locations)
Details of the survey were sent to as many retailers as possible (mainly those that had attended previous ECR Retail Loss Group events) and information about it was also posted on LinkedIn. Few details were collected about the companies taking part although it was possible to differentiate between Grocery and Non-grocery respondents. In total 81 retailers responded from 20 countries – Europe (47), North America (28), Australia (5), Middle East (1). They were mainly large retailers with a combined turnover of just over €2 trillion, equating to approximately 12% of the global retail market. The majority were from the Grocery sector (60%). As such, caution needs to be exercised when reviewing and interpreting the data in this report. In addition, while a short description was provided for each of the video analytics included, respondents may have interpreted their purpose and operation in different ways.
Key Findings
The findings have been broken down in to three main sections. The first section offers a summary of the extent to which video analytics are being considered across the various areas of the retail supply chain. The second section provides a summary of the most deployed video analytics, first for all respondents and then by type of retailer. This is followed by those which are most commonly being trialled or planned for future use. The third section then provides a more detailed breakdown of the extent to which all the 47 video analytics are either being used or trialled/planned, this time broken down by where they are used across the retail supply chain.
Overall Utilisation of Video Analytics
To understand the extent to which video analytics are either being deployed or trialled in different parts of the retail supply chain, it is important to take in to account the number of analytics under consideration and the number of retailers that responded to the survey. For instance, respondents were asked about 9 types of video analytic in the Store Checkout Area while in the Store Entrance area they were asked to consider only 4. To take account of this variability and enable valid comparisons to be drawn, a Video Analytic Utilisation Rate has been calculated. This is based on a scale from 0 to 100, where a score of 100 would represent ALL respondents using ALL of the analytics, while a score of 0 would represent a situation where NONE of the respondents were using ANY of the analytics. This score provides a way of both comparing the relative use of video analytics between different retail locations and differences between current deployment rates and planned/trialled use.
As can be seen in Table 1, the overall deployment of all types of video analytics is currently very low, a utilisation rate of just 7%. The area where they are most frequently deployed is around the store environment (15%), the Store Entrance (8%) and in Retail Distribution (8%). Two areas within the store currently have the least deployment – the Shopfloor (5%) and the Checkout area (5%).
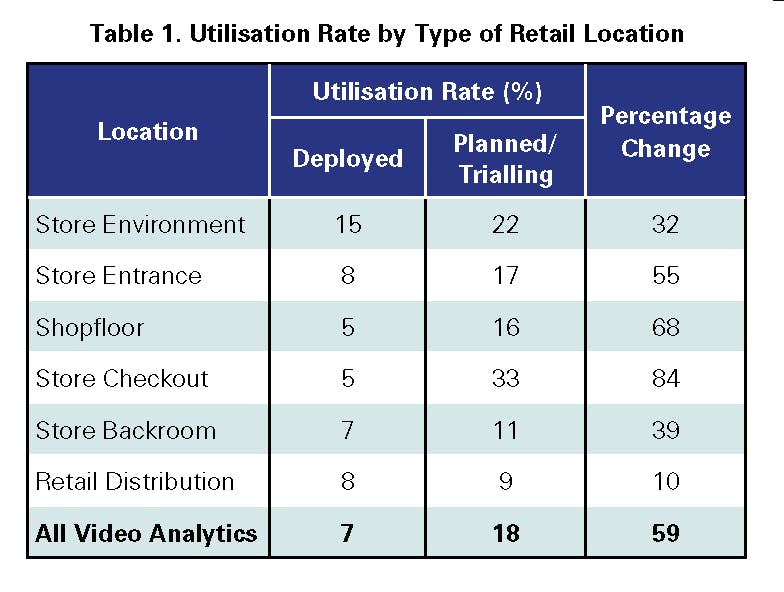
However, the data clearly indicates that respondents have considerable plans for possible future utilisation of video analytics compared with the current situation. Overall, the planned/ trialling utilisation rate is 18%, which equates to a 59% increase on current rates of deployment. Of particular note is the Store Checkout area, which has an 84% increase in its possible utilisation rate (5% deployed – 33% planned/trialled). Equally, the shopfloor area is another area where respondents are clearly thinking about expanding their use of video analytics – a 68% increase in potential utilisation. Overall, the data suggest that while current rates of use are low, retailers are beginning to both recognise and prioritise the growing use of video analytics within their organisations.
Top Five Video Analytics
The following section summarises the data on the five video analytics that were most frequently deployed across all forms of retail location, firstly for all respondents and then broken down between Grocery and Non-grocery retailers (Tables 2, 3, and 4)
Deployed: All Retailers
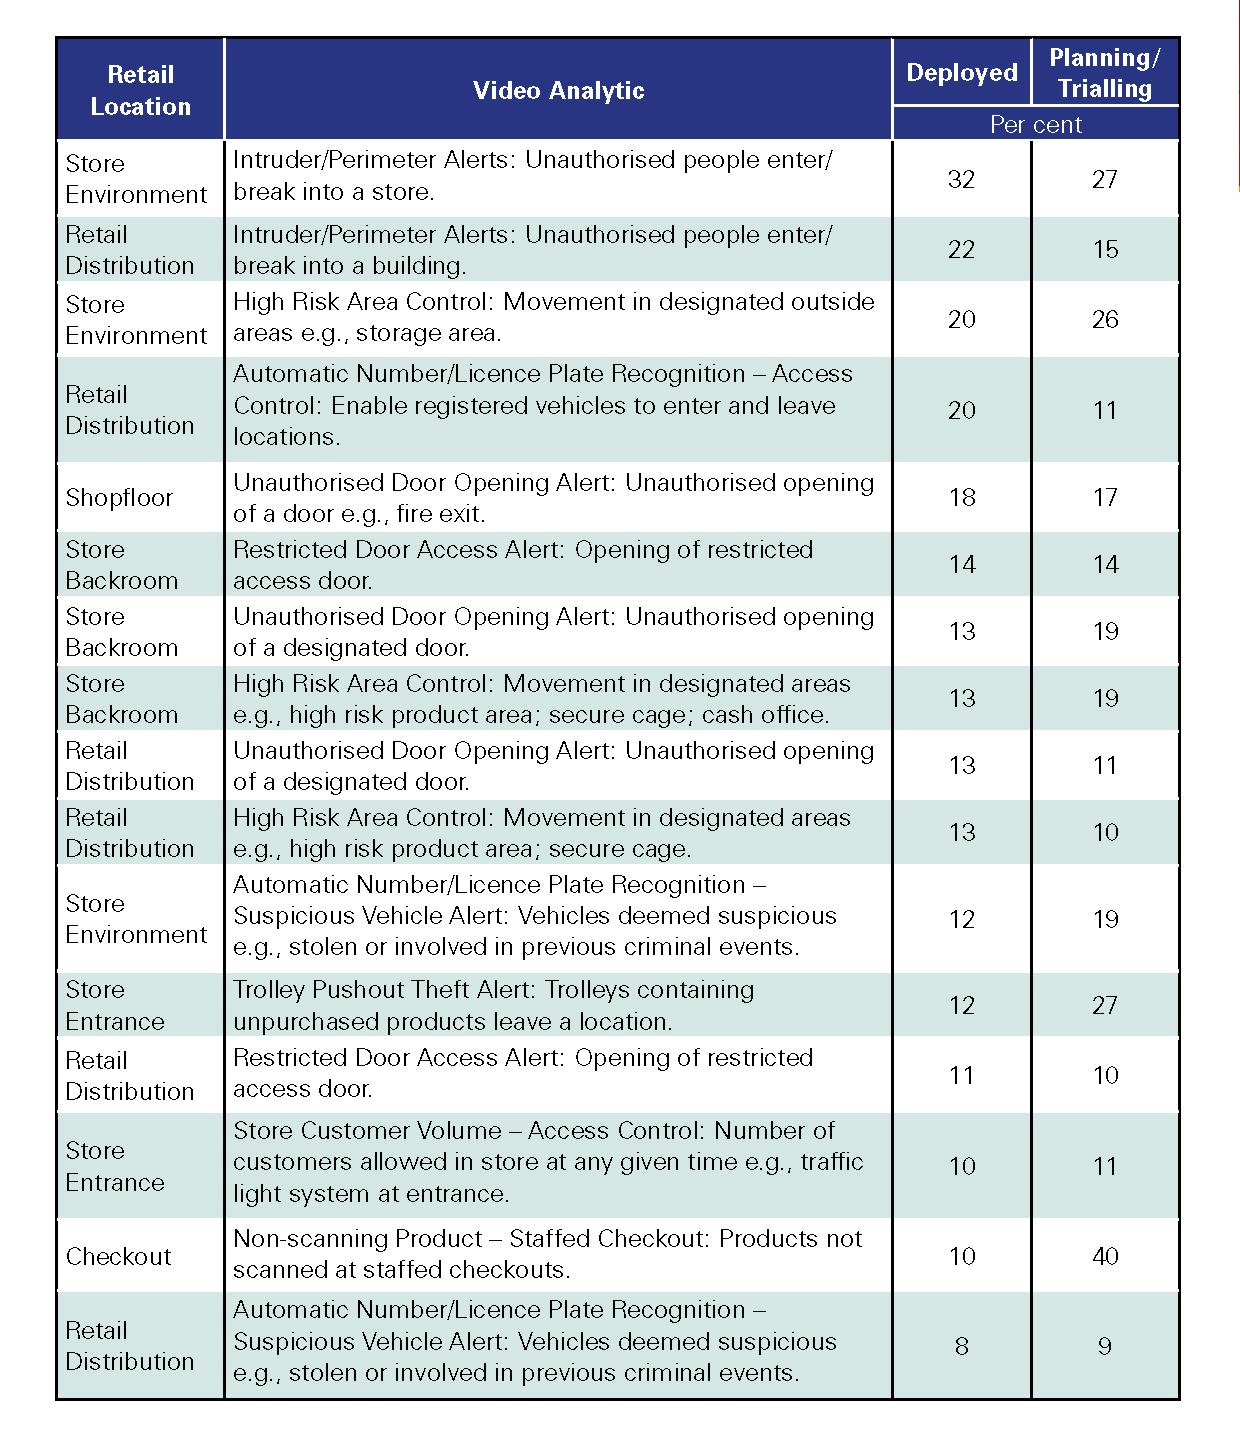
As can be seen, all five of the most deployed video analytics are focused explicitly on security/ safety issues. The most deployed is the use of an analytic to generate an alert when an intruder is attempting to gain access to a retail store (32%), followed by the same analytic but deployed in retail distribution (22%).
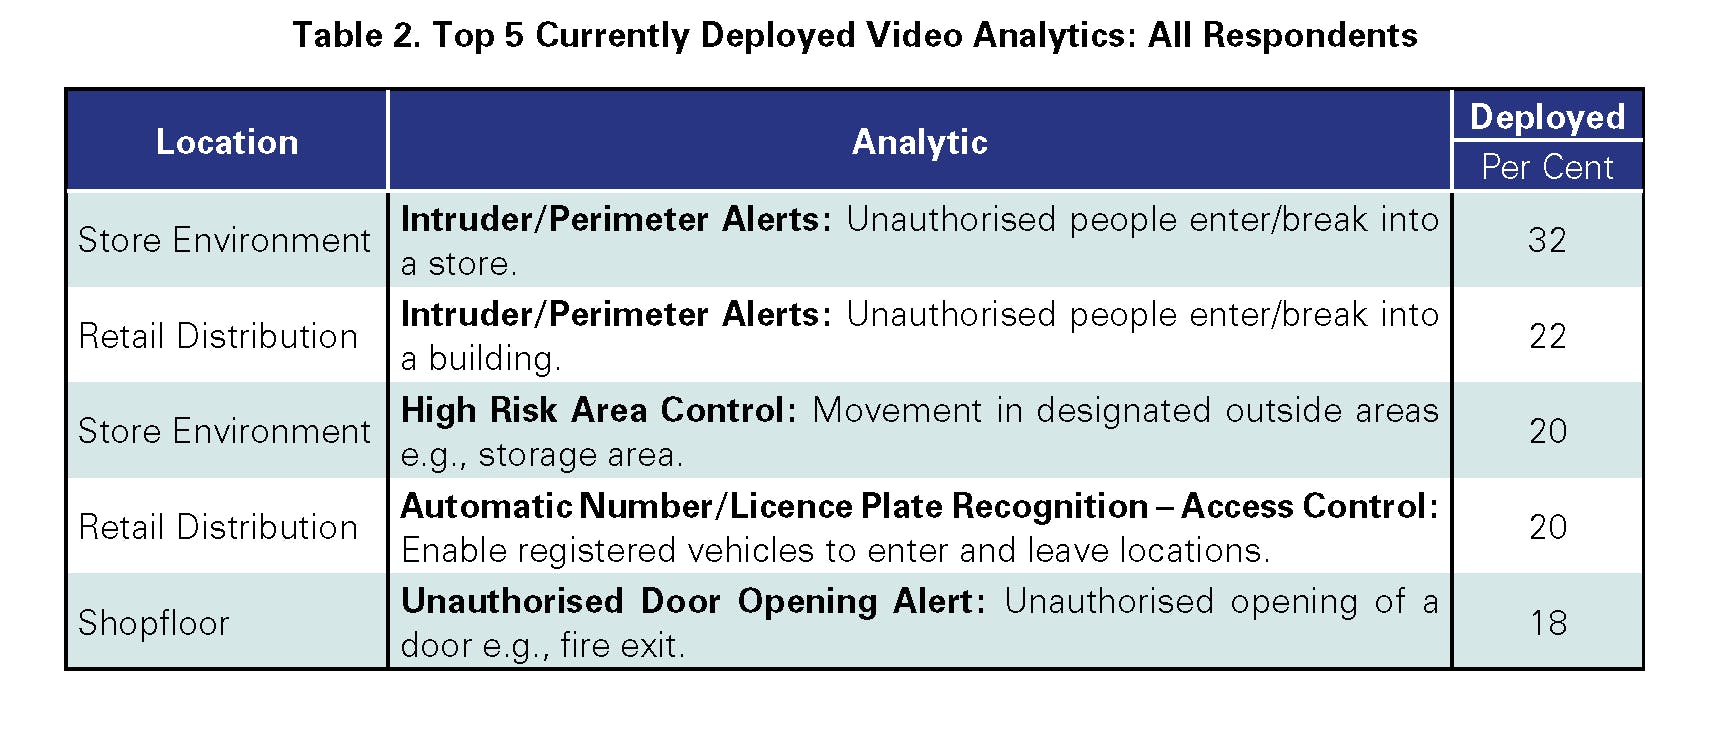
In addition, one in five respondents had also deployed a video analytic to provide an alert when there was movement within a high-risk control area outside their stores (20%). A similar percentage had deployed automatic number/licence plate recognition analytics in their retail distribution network to control access (20%). Finally, the fifth most deployed analytic was on the retail shopfloor to generate alerts when there was an unauthorised opening of a door, such as a fire exit. (18%).
Deployed: Grocery v Non-grocery
It was possible to differentiate the results between two broad types of respondents – those that were Grocery retailers and those that were Non-grocery retailers. Detailed in Table 3 are the top five most deployed video analytics for Grocery retailers only.
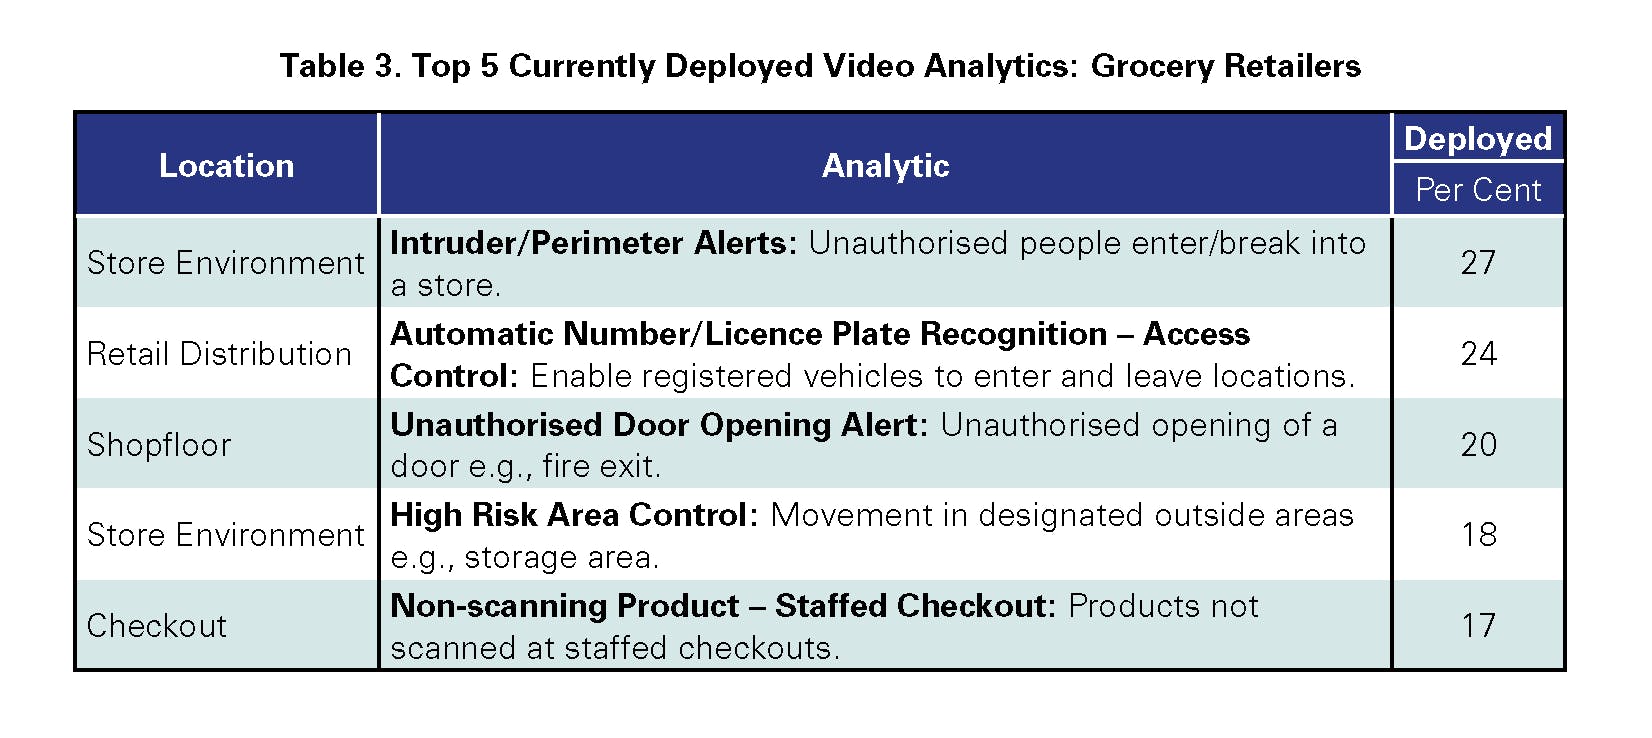
As can be seen, four of the five video analytics are the same as those for all retailers, albeit with a slightly different ranking. The main difference is the inclusion of the video analytic to alert when non scanning has occurred at a staffed checkout, which replaces the use of a video analytic to generate intruder alerts at distribution centres.
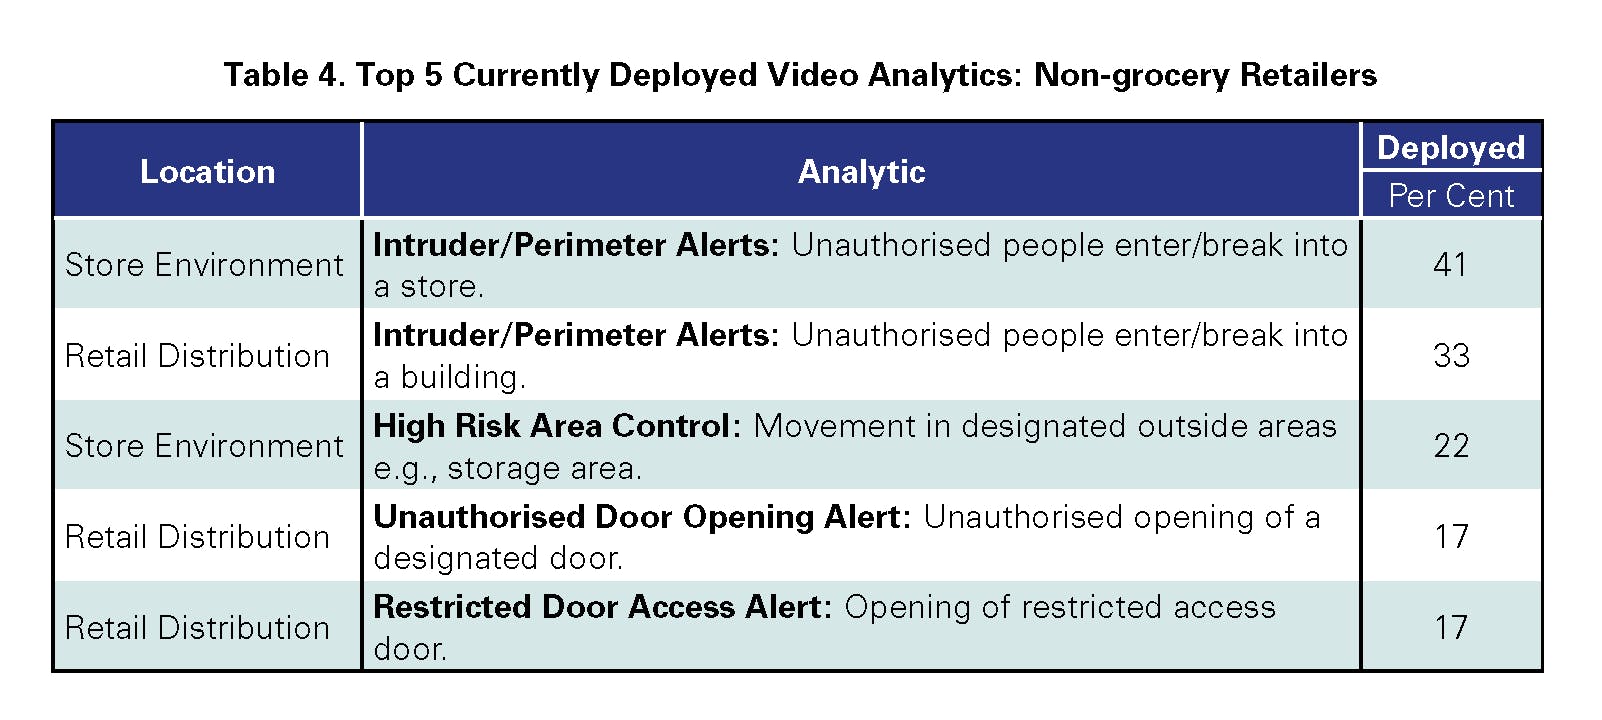
As can be seen in Table 4, for Non-retailers, the picture was little different, although overall rates of adoption of the top two analytics was higher than that found in Grocery. There was only one different video analytic in the top five – restricted door access alert, which was being used in the retail distribution environment.
Planned/Trialling: All Retailers
A very different picture emerges when the top five video analytics currently being trialled or planned are reviewed. Here you can see the dominance of the Store Checkout area as a place of considerable interest (Table 5).
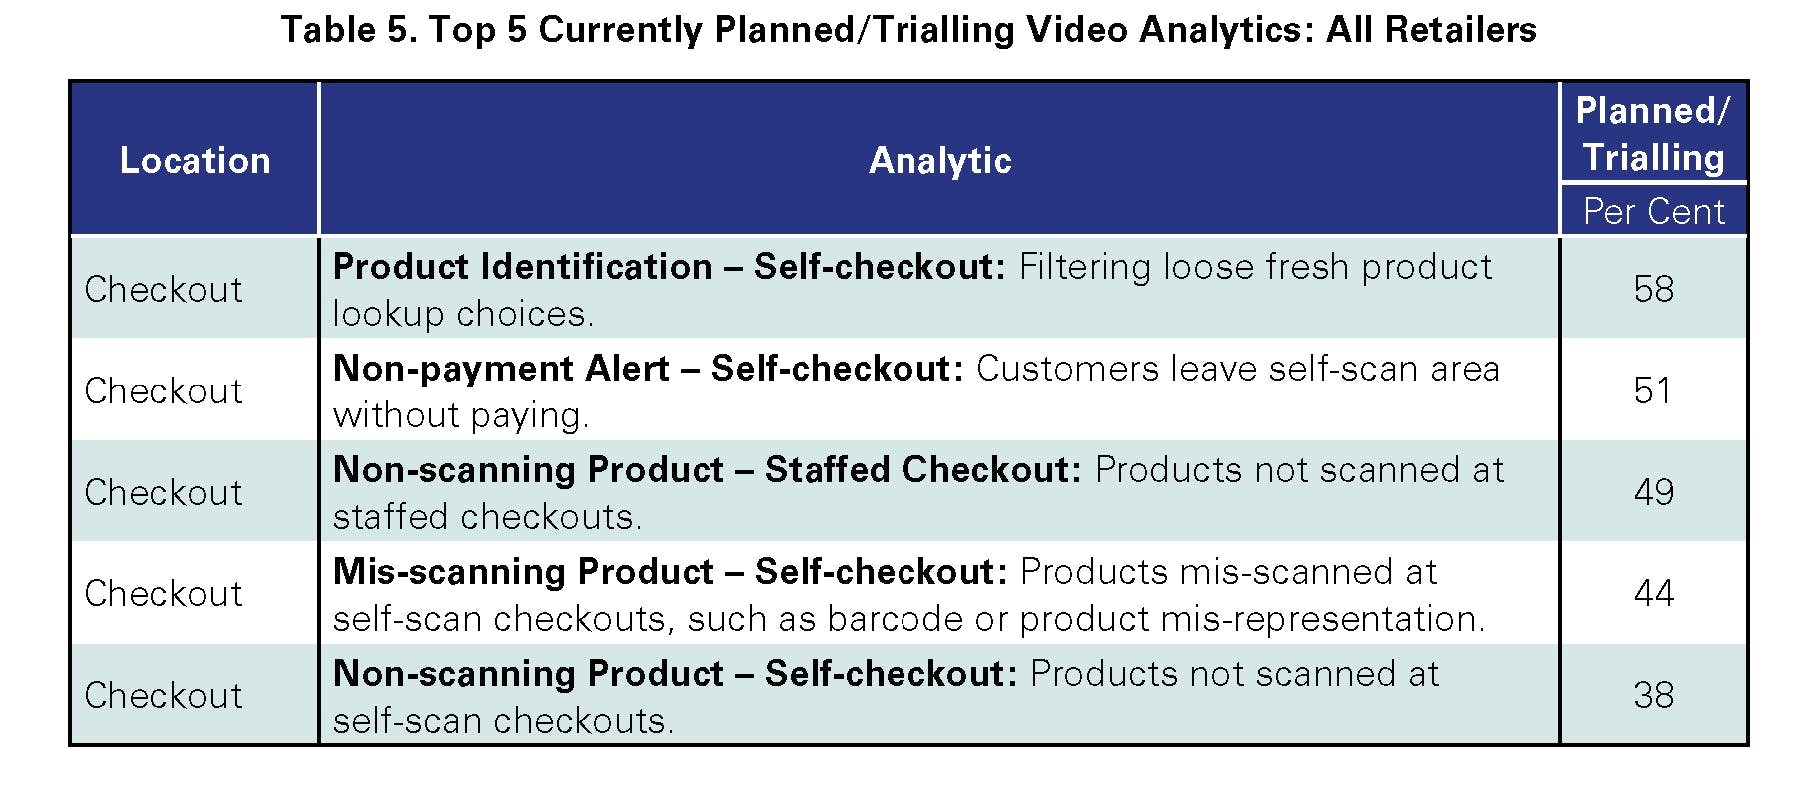
Strikingly, nearly 60% of all respondents said that they were currently either planning to trial or trialling a video analytic focussed upon helping consumers navigate the loose product lookup process at self-checkout stations (58%). The second most common video analytic was aimed at generating an alert when customers left a self-scan area without paying (51%). In third place was a video analytic to identify non-scanning at staffed checkouts (49%), followed an analytic to identify mis-scanning at self-checkouts – customers mis-representing product on the weigh scale or using the wrong barcode (44%). The fifth most common checkout-related analytic was for the identification of nonscanning at self-checkouts (38%).
While the overall order may be somewhat surprising, not least non-scanning at self-checkout being fifth, what is very striking is both the level of interest and the dominance of the checkout area as an area of focus.
Planned/Trialling: Grocery v Non-grocery
Perhaps not surprisingly, given the rapid growth of self-scan checkout technology in Grocery retailing, the top 5 analytics were all in the checkout area (Table 6).

Here you can see the extent to which the majority of all Grocers were investing in these video analytics – nearly 70% planning or trialling non-product scanning alert analytics at self-scan, with 65% looking at mis-scanning in the same area. In third place was non-payment alerts analytics (59%), followed by product identification (51%), and finally non-scanning analytics at the staff checkout (50%). The data is very clear, self-checkout is a very strong area of interest for the Grocery sector when it comes to video analytics.
Perhaps not surprisingly, a different picture emerged for Non-grocery, where investment in selfcheckout is still relatively immature (Table 7).
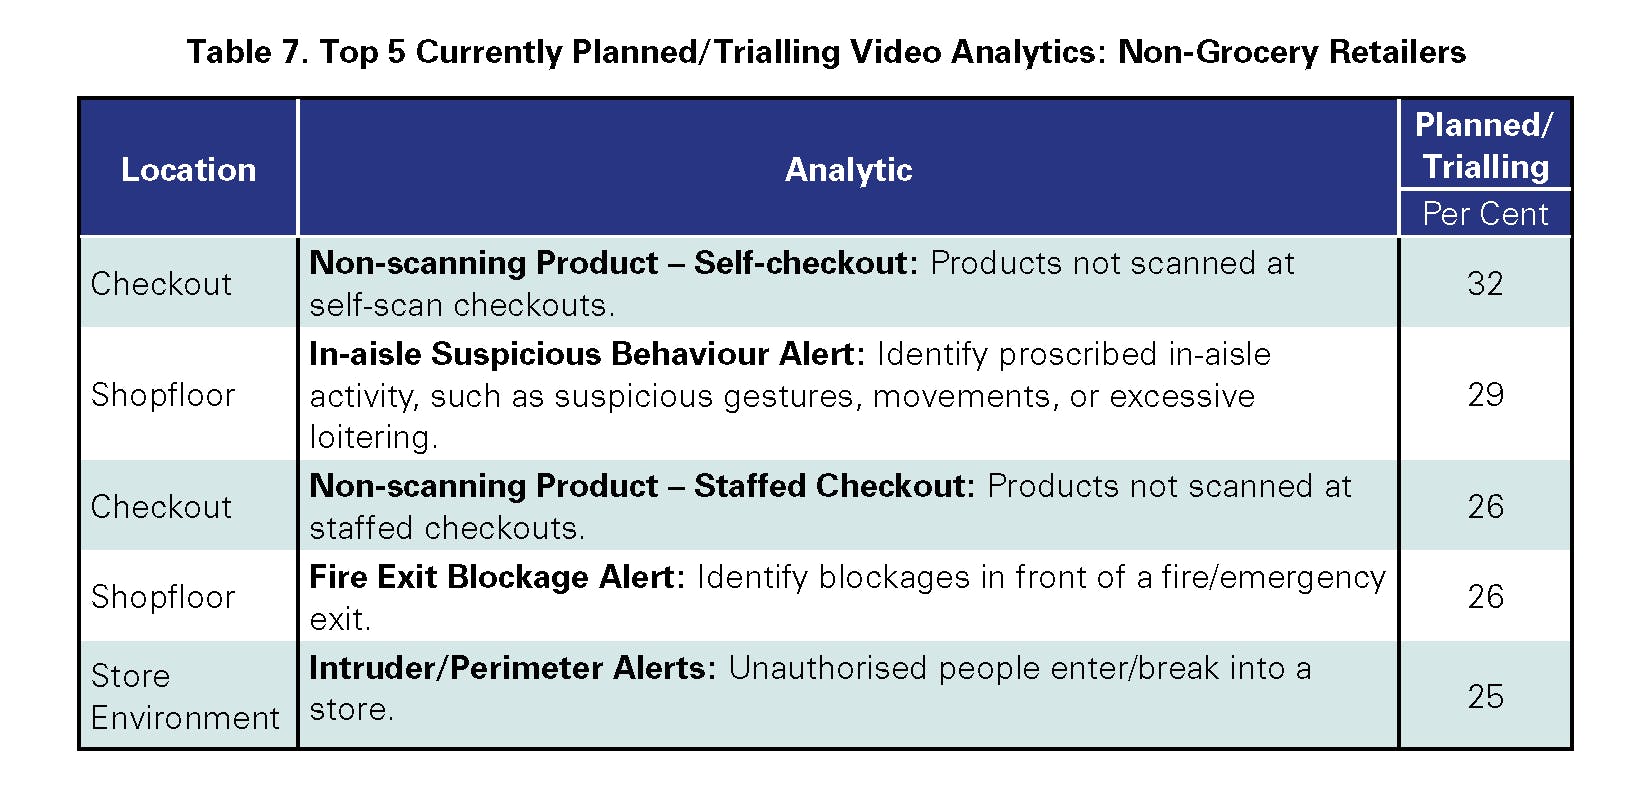
While non-scanning at self-checkout (first) and staff checkouts (third) featured in the top five, the second most selected video analytic was focussed upon identifying suspicious behaviour in the shop aisle (29%). The other two analytics to feature were both focussed on assisting in the safety/security of the retail store – generating alerts when fire exits were blocked (26%) and enhancing the capability to identify when intruders were breaking into a building (25%).
Use of Video Analytics by Retail Location
This third section provides a more detailed breakdown of all the video analytics covered by this survey, organised by utilisation within the retail supply chain and comparing rates of deployment against rates of trialled/planned use.
Store Environment
The survey asked respondents to consider their use of five video analytics in the Store Environment – this refers specifically to the space immediately surrounding a store, such as car parks/parking lots, storage spaces and goods loading areas (Table 8). The percentages refer to the actual number of respondents who stated they had either deployed or were planning/trialling the video analytic.

Nearly one-third of all respondents stated that they had deployed a video analytic that provided an alert when unauthorised people entered or tried to enter one of their stores (32%). The next most deployed analytic operated in a very similar manner – providing an alert when there was movement in a designated high-risk area, such as an outside storage facility (20%). The remaining three analytics were much less frequently deployed, with only 5% of respondents stating they had deployed a system that could provide alerts when threatening behaviour was occurring.
Across all five analytics, there was evidence of a good degree of trialling/planning to use them in the near future, with particular interest in threatening behaviour alerts (20%), automatic number/licence place recognition (19%) and reverse flow/movement alerts (18%).
Store Entrance
With regards to the store entrance, just four analytics were proposed (Table 9).
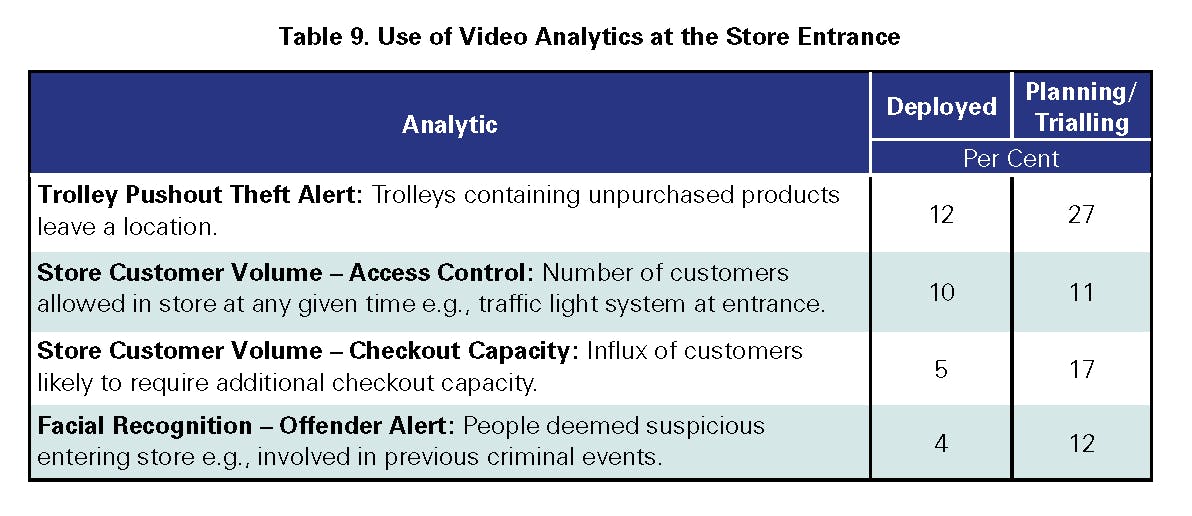
As can be seen, rates of adoption in this space are very low and it is unclear the extent to which the most frequently deployed analytic – Trolley Pushout Theft Alert – was correctly interpreted by respondents as a video analytic as defined at the start of this report. There are currently two main providers of a technology that addresses the issue of trolley pushout thefts, both of which primarily rely upon a non-video-based trigger system to activate a wheel lock on suspect trolleys. There are other providers that do rely upon a video-based system to identify suspect trolleys, but it would seem surprising that 12% of all respondents to this survey had currently deployed such a relatively niche technology. It is also interesting to note that only 4% of respondents stated that they had currently deployed any form of facial recognition technology, although three times as many did state that they had plans/trials underway (12%).
Shopfloor
The store shopfloor is an area that has seen a considerable amount of interest when it comes to the development of video analytics, both for security and safety purposes and to improve business productivity. A total of 12 video analytics were considered by respondents in this space (Table 10).
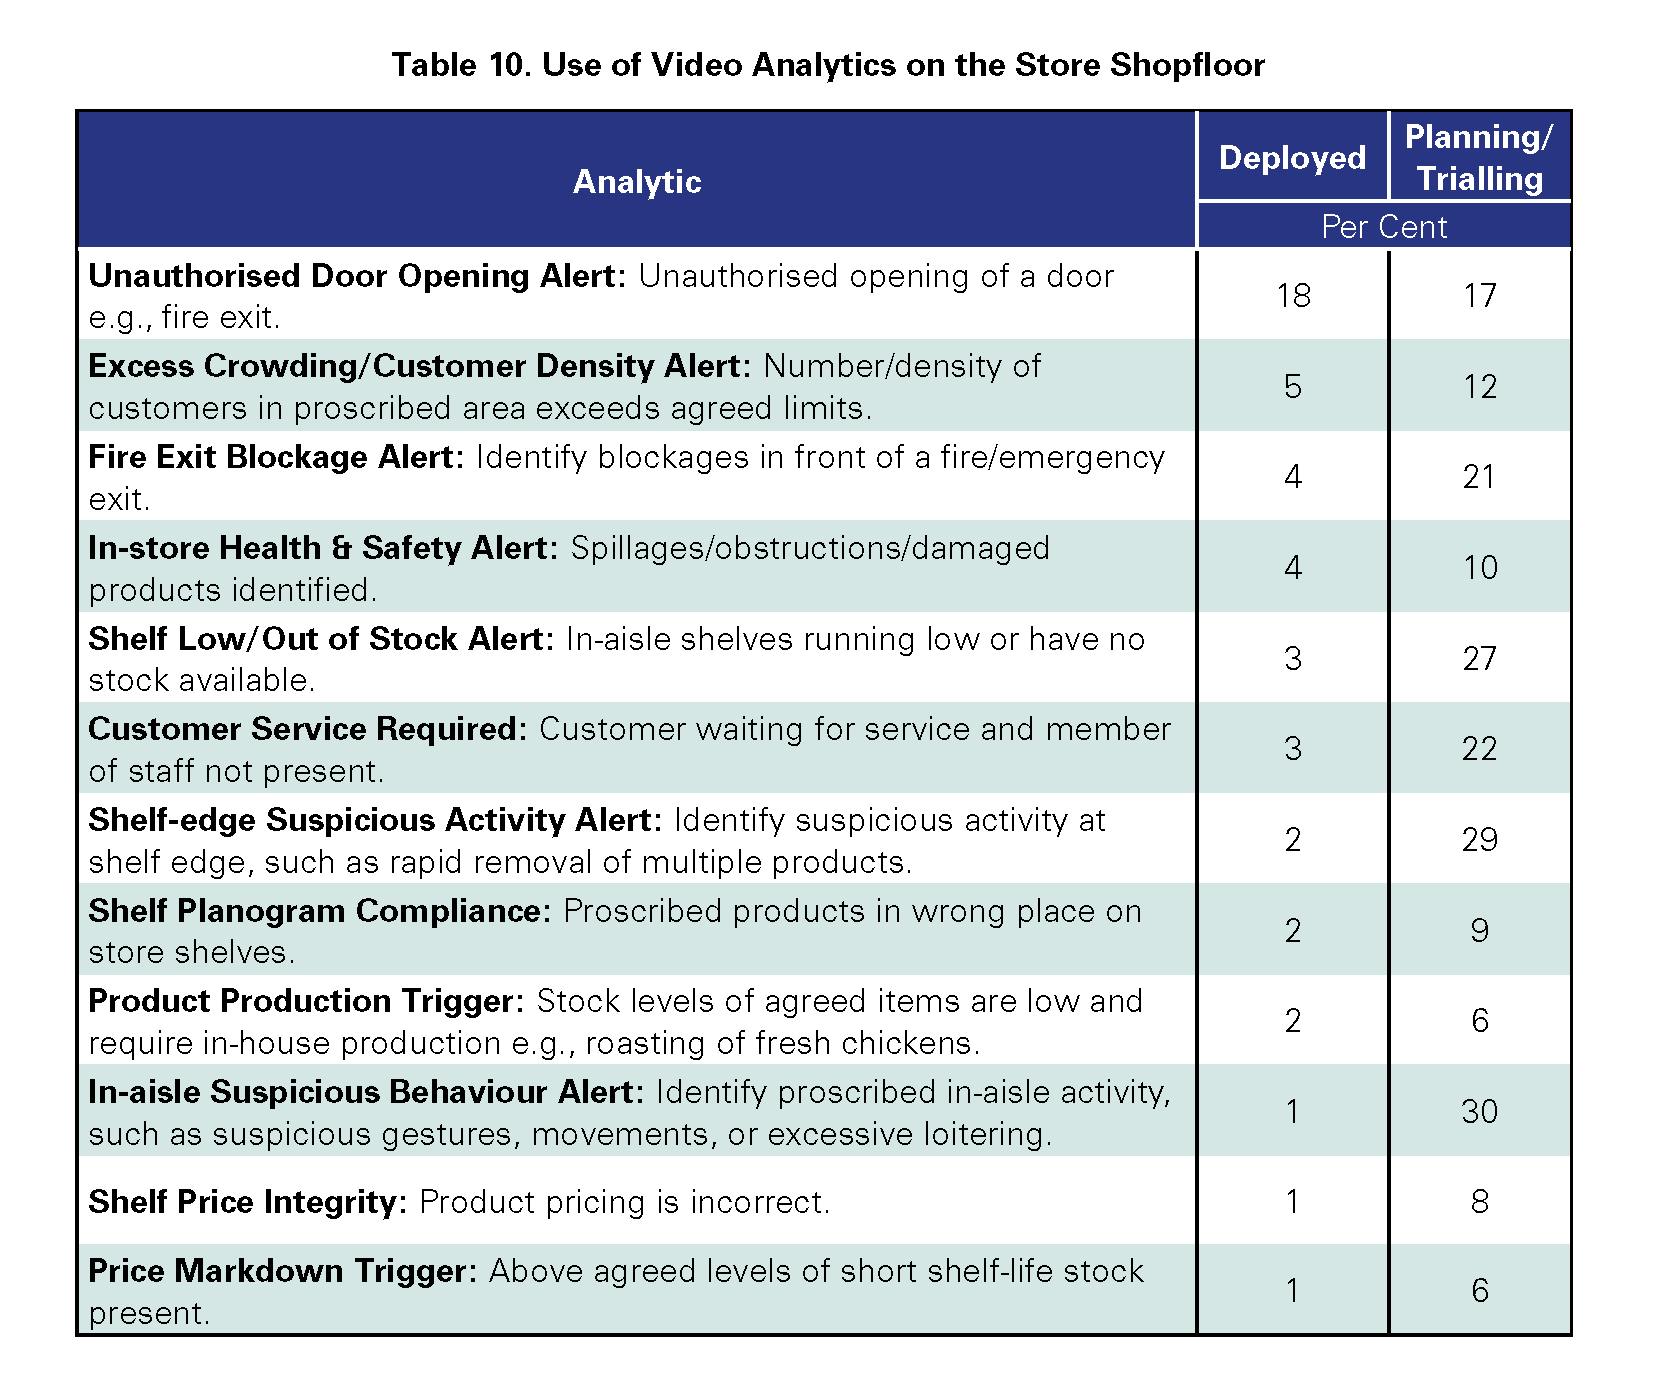
By far and away the most frequently deployed video analytic in this space was the generation of an alert when an unauthorised door was opened, such as a fire exit (18%). A common tactic adopted by professional thieves is to avoid leaving stores via the traditional entrance/exit, where security staff are often stationed, and instead force open a fire exit door to make their escape with stolen goods. The other 11 analytics were much more rarely deployed thus far – excess crowding alerts (5%) fire exit blockage alerts (4%) and in-store health and safety alerts, such as when a spillage had occurred (4%), were the next most frequently deployed. At the other end of the spectrum, stock related analytics (price markdown triggers and shelf price integrity checking) were very rarely deployed thus far, as was in-aisle suspicious behaviour alerts.
However, there was evidence of considerable trialling and planning of future use of a range of video analytics in this space. Of note was in-aisle suspicious behaviour alerts – nearly one-third of respondents (30%) stated they were trialling or planning to try this analytic soon. A similar number were also interested in shelf-edge suspicious activity alerts (29%) and shelf low/out of stock alerts (27%). It would certainly seem from this data that the shopfloor is likely to be an area of considerable video analytic testing and deployment soon.
Store Checkout
Like the shopfloor, the retail checkout space is an area where there is a growing number of video analytics in operation, not least because of the rising use of self-checkout technologies which have presented retailers with new loss control challenges (Table 11).
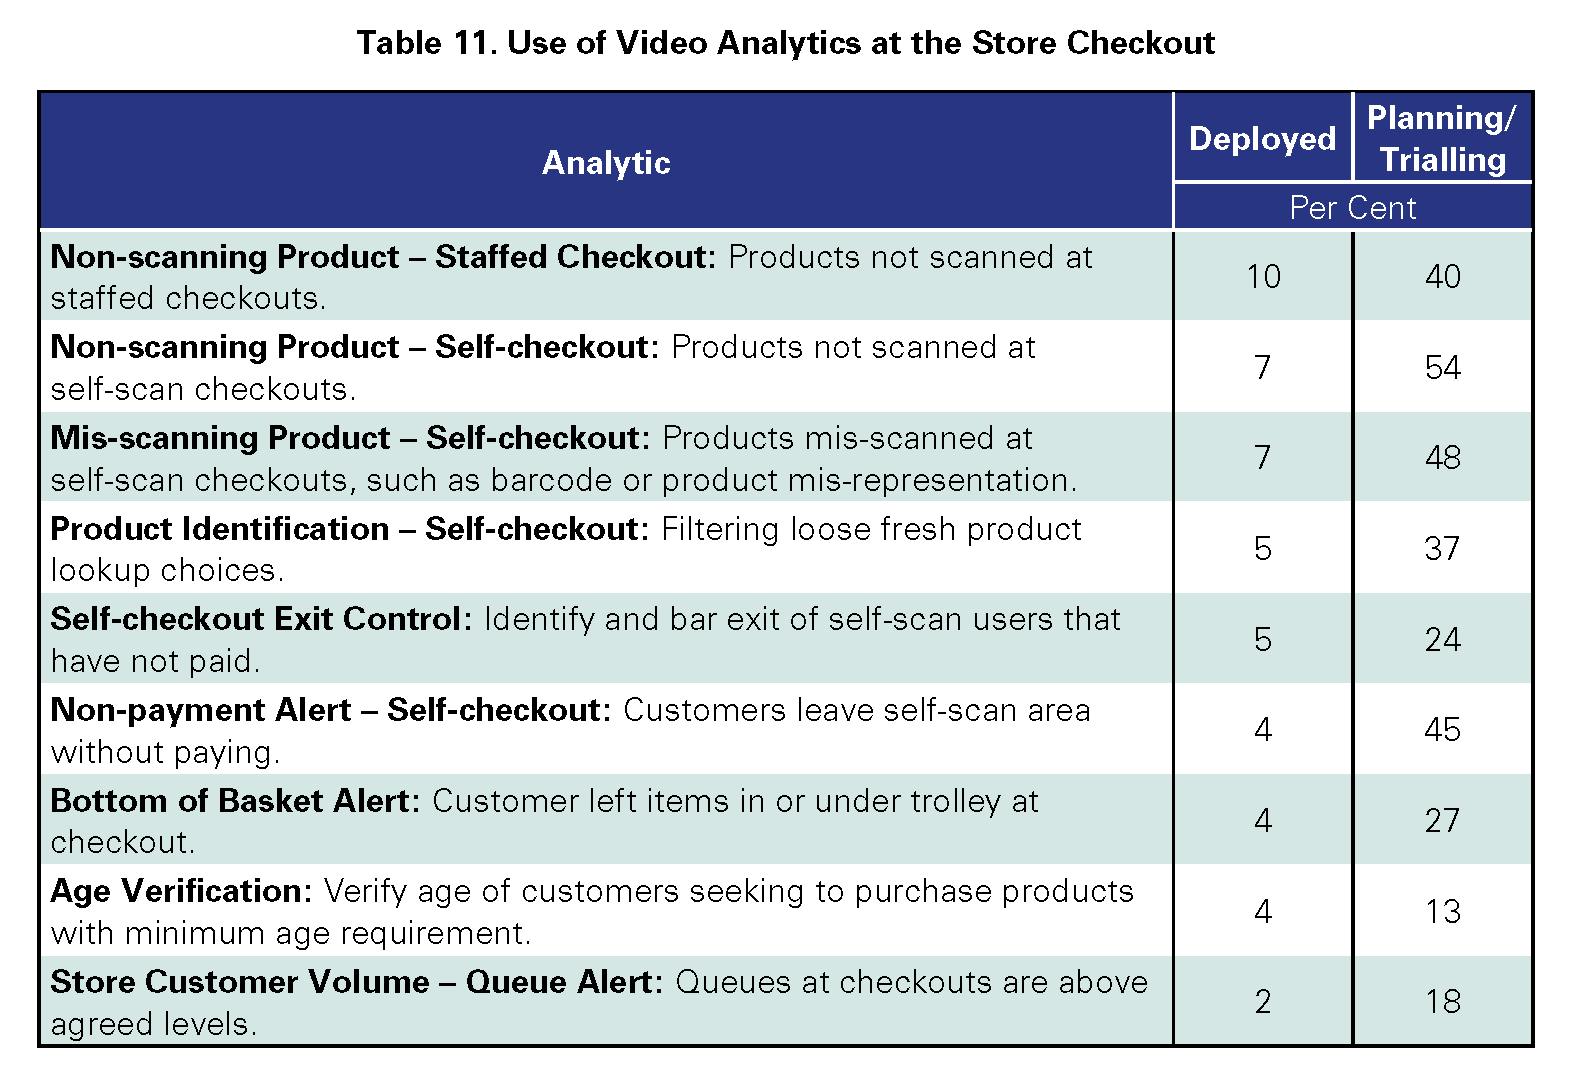
Respondents were presented with nine types of video analytic, and as can be seen, overall, current deployment rates are relatively low although it was the area with some of the highest rates of planning/ trialling underway. In terms of current deployment, the most deployed video analytic thus far was for the identification of non-scanning at staff checkouts (10%), followed by the same technology but focussed on self-checkouts (7%) and the use of a video analytic to identify mis-scanning at selfcheckouts (7%) such as the use of the wrong barcode or the mis-representation of a cheaper product for a more expensive item.
Concerns about losses associated with self-checkout and the potential of video analytics to help control them was very evident when looking at the extent to which they were being planned/trialled. Over one-half of respondents stated they were planning/trialling video analytics to identify non scanning at self-checkouts (54%), with almost as many for identifying mis-scanning (48%) and nonpayment alerts (45%).
Store Backroom
The penultimate area under consideration in this study was the store backroom area. Here, respondents were asked to consider the use of six video analytics (Table 12).
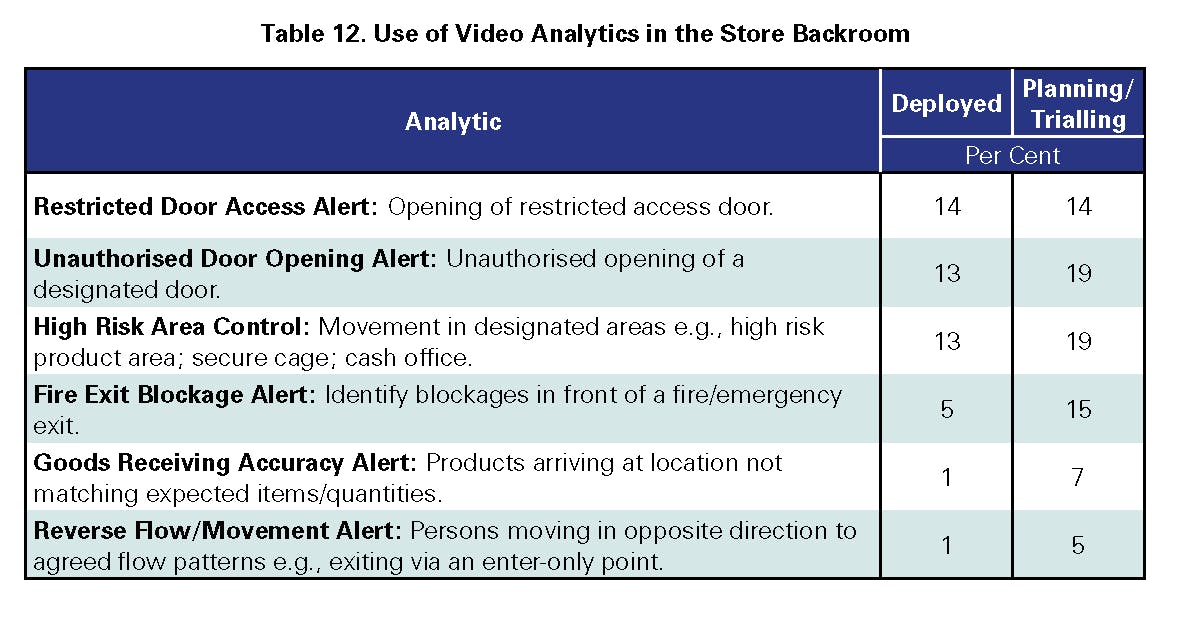
While overall levels of deployment were relatively low across the six analytics, three were much more likely to be deployed than the others – restricted door access alert (14%) was the most common, followed by unauthorised door opening alerts (13%) and the identification of movement in areas deemed to be high risk, such as secure cages and cash office (13%). These three were also the main areas where future use/trialling was underway, supplemented by fire exit blockage alerting. Currently there would appear to be little utilisation of goods receiving accuracy alerts and reverse flow/movement alerts in this part of the retail supply chain.
Retail Distribution
The final area of interest was the use of video analytics in retail distribution spaces, where respondents were asked to consider 10 analytics (Table 13).
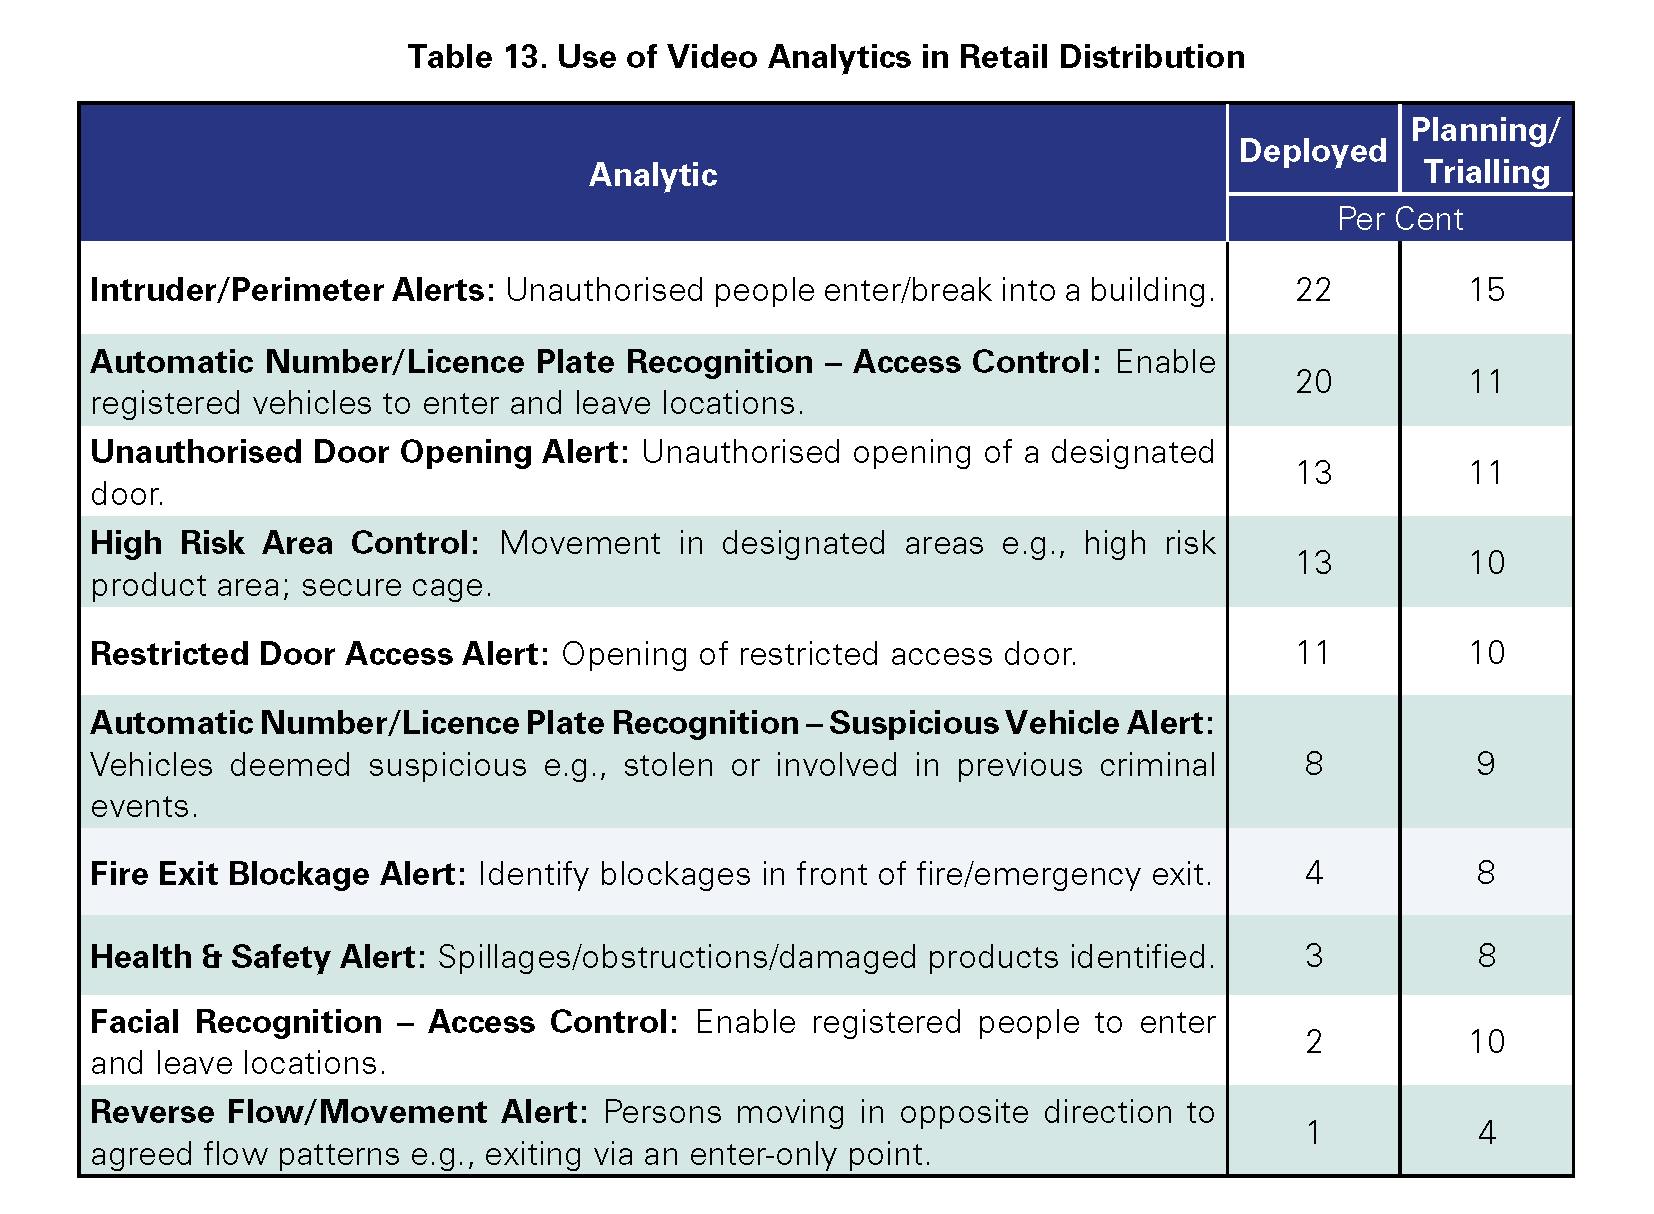
The most commonly deployed analytic thus far was for the generation of alerts when intruders were trying to penetrate building (22%), followed by the use of automatic number/licence place recognition to manage access control (20%). Those least deployed thus far were focused upon generating alerts when a reverse flow/movement event was identified, such as staff passing in the wrong direction through doorways (1%) and the use of facial recognition to facilitate access control (2%).
There was little evidence of a significant expansion in the use of video analytics soon in this part of the retail landscape, although of note was a fivefold increase in interest in the use of facial recognition as a form of access control (10%).
Summary
Current Utilisation – Limited and Focussed
While sometimes it can be hard to unravel hype from reality, the growing ubiquity and capability of some forms of technology is clear to see. Video is a good example of this. Where once the generation and distribution of ‘moving images’ was an expensive and highly technical task, today, the Tik Tok generation upload and watch over 1 billion videos a day; nearly three-quarters of a million hours of video are uploaded to YouTube every day.
Of course, the use of video technologies in retailing is nothing new – some of the earliest forms of ‘closed circuit television’ (CCTV) were used in a retail setting, but up until recently it remained a largely passive technology, its purpose not overly clear beyond offering some form of security blanket. In part this was a function of the technology itself – analogue video, in data terms at least, offered little analytical capability. Even something as simple as searching analogue video footage presented a daunting task, requiring humans to physically ‘watch’ potentially hundreds of hours of recorded footage looking for a point of interest. The advent of ‘digital’ video has transformed the capability landscape, enabling ‘video data’ to be collected, analysed, and acted upon in the same way other forms of data have been utilised in the past. This has led to the growth of ‘video analytics’ – computer-based systems that can generate value from digital video images.
The current survey offers a snapshot of the extent to which the retail industry is beginning to engage with the development of video analytics. What it found was that to date, the adoption of video analytics is currently very low – an overall utilisation rate of just 7%. However, the data also identified a clear trend towards significant future interest in and use of video analytics – it would seem to be an area on the cusp of much greater utilisation across a range of retail settings. In particular, areas around the retail store checkout and in the aisles seem to be areas of considerable testing and future development. Moreover, for Grocer retailers in particular, the interest in video analytics seems particularly pronounced, driven in large part by their growing cncerns around the use and control of self-scan technologies. The data suggests that video technologies in general, and video analytics in particular, could be one of the major growth areas in retail technologies in the near future.
Characteristics of Successful Video Analytics – Binary Clarity
When the current range of video analytics currently in use are considered, what seems clear is that they are dominated by the relative clarity and simplicity of their purpose – their task is often highly binary in nature – presence or absence, activity or no activity, open or closed. If we look at the top five analytics currently being used, four out of five clearly meet this criterion: Intruder Perimeter Alert (store and retail distribution); High Risk Area Control Alert; and Unauthorised Door Opening Alert – all require the video analytic to identify a relatively simple change in the status quo – no person present, person present; door closed, door open.
In many respects the fifth analytic in the top five adopts a similar position although it is a little more nuanced – Automatic Number Plate Recognition Access Control. In this example, the outcome is still binary – allow or deny vehicle entry, but the difference is that the video analytic is attached to a database of licence plate numbers that can be interrogated.
What you do not see in these circumstances is much complexity in the operating environment – the Perimeter Alert system is not typically having to decide whether some humans passing through the space are legitimate while others are deemed to be intruders – it is designed so that the decision is much clearer cut – anybody who enters that space is deemed worthy of an alert. Similarly, the Unauthorised Door Opening Alert is not required to distinguish between openings that are legitimate and those that are not – all openings warrant an alert. This Binary Clarity seems to be an important distinguishing feature in the types of video analytics that have proven successful thus far.
Impact of Operating Complexity
When we begin to look at the range of other video analytics that are either much less used or planned for future development, what can be seen is a growing level of operational complexity and a broader range of outcomes. Let’s look at some examples. The Checkout area was the dominant space for future developments – Product Identification, Non-payment Alerts, Non-scanning of Products and the Mis-scanning of Products. Compared with the Binary Clarity described earlier, these are far more complex and challenging environments for video analytics to operate within. For instance, Product Recognition – large grocery stores could contain upwards of 100,000 differently identifiable products; products may be placed in a bag – can the analytic see into the bag? What if two products are on top of each other – will the analytic recognise one, both, none? Similarly, Non-scanning at the checkout – can the video analytic understand when it is a consumer’s hand and not a product moving across the surveilled space? What if products are stacked on top of one another? What if the consumer does not present the product anywhere need the defined area? Again, the levels of complexity are much more considerable than the Binary Clarity examples offered earlier.
Undoubtedly, the technology and computing technology is developing quickly in this space but what seems clear is that the new generations of video analytics are being required to operate in ever more complex and challenging environments and this is likely to lead to a higher degree of error, in particular false positives, where the system triggers when it should not.
The False Positive Consequence Continuum
Ideally, a video analytic works as designed and only generates an alert or action when a predefined and prescribed activity or event takes place – a True Positive. The opposite is where the system does not trigger when such an event or activity has taken place – a False Negative. There are then triggers which generate False Positives – the system thinks it has identified an event or activity that meets the predetermined requirements, but it is in fact incorrect. Finally, there are what can be described as Overload Positives where, due to ill-defined and overly inclusive parameters being set, the system generates an unacceptably high number of trigger events that are technically correct but simply overwhelm the human resource tasked with responding.
Whenever a video analytic generates an outcome other than a True Positive, then this can have consequences and the context and operating parameters within which the analytic is operating is likely to dictate the extent to which the consequences have an impact. For example, a False Positive wrongly identifying that a customer has not scanned an item at a self-checkout will likely lead to a slight delay while a member of staff checks and resets the system, resulting in at best very mild consumer irritation. At the other end of the spectrum, a False Positive from an analytic designed to alert when a lone shooter (gunman) is approaching a retail store could generate widescale panic, possibly a stampede of customers from the store, armed police arriving, closure of the store, possible lawsuits from distressed customers. The consequences of getting it wrong could be profound, but it could also work the other way as well – the video analytic fails to identify a lone shooter (A False Negative). In this circumstance, not only deaths could occur because the system failed but also the retailer could be held liable for the failure of the analytic.
While the latter example is probably very much at the extreme end of the False Positive Continuum, it will be important for practitioners utilising video analytics to reflect upon the possible consequences of any occasions when the analytic does not deliver the desired outcome. This will become even more important as we see types of video analytics being introduced into ever more complex retail environments and with more challenging objectives way beyond the ‘binary clarity’ currently being seen.
Video Analytics – Offering Deliverables not Distractions
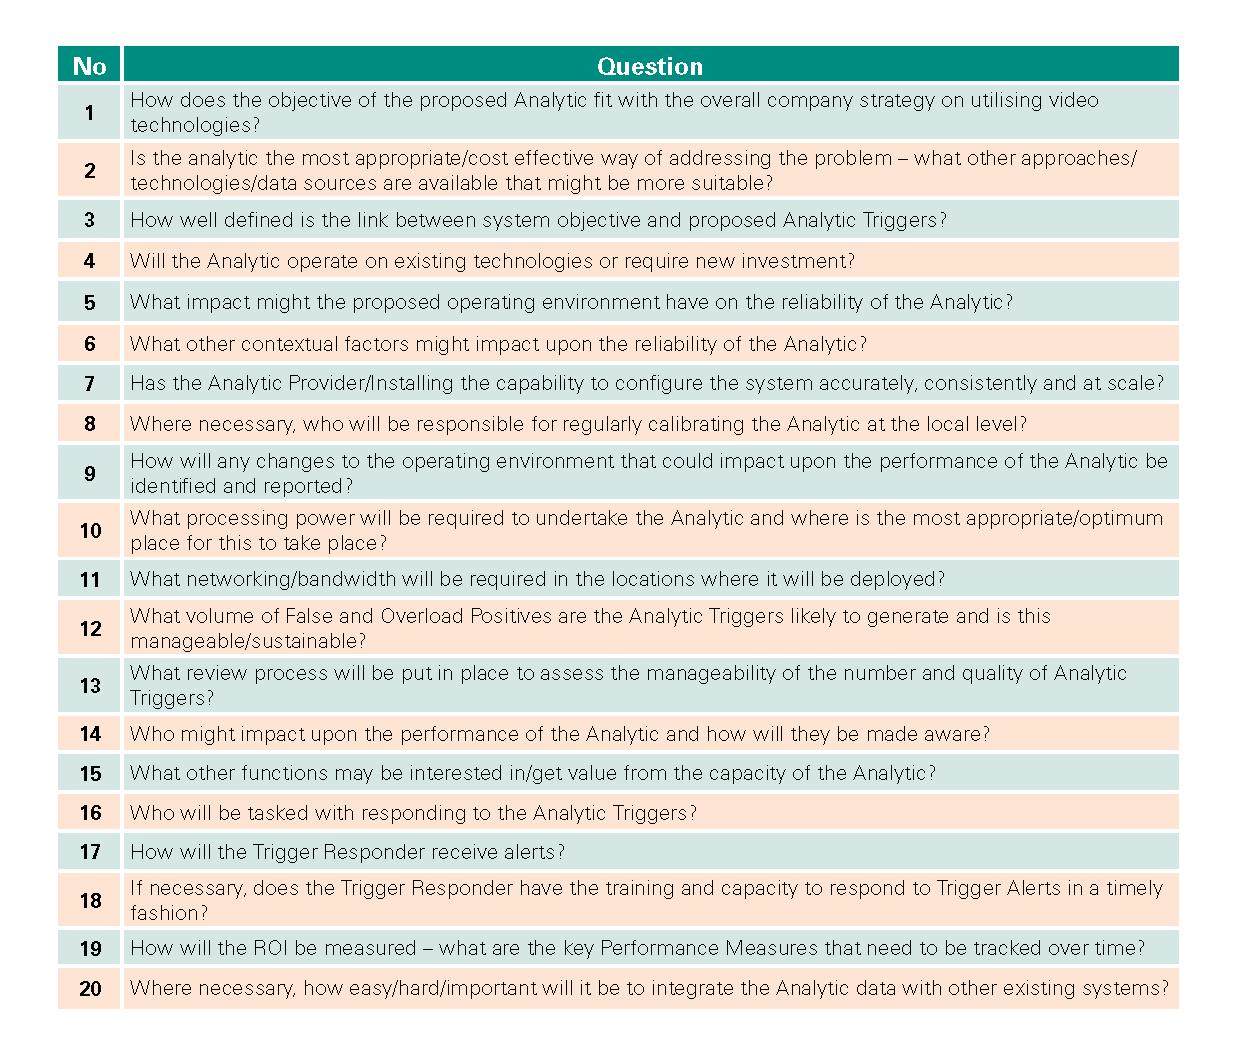
This ECR Retail Loss survey has provided a fascinating insight into how retailers are currently using video analytics and what the likely areas of future development might be. It would seem an exciting and rapidly developing area, but, like any emerging new technology, it will be important to ensure that it offers value-added deliverables. Most video analytics operating in a retail environment are highly influenced by the complexity of the environment within which they are tasked to operate – the greater the complexity, the greater the challenge to get them to work as designed. It will be important, therefore, that retailers ensure that any given video analytic genuinely delivers value rather than simply becoming an ongoing and unwelcome distraction for those tasked with meeting the core goals of the business. To help with this process, a checklist has been reproduced from the ECR Retail Loss Report Assessing the Use of Video Technologies in Retailing, which provides guidance on how a prospective video analytic can be assessed within a given retail context (Appendix III).
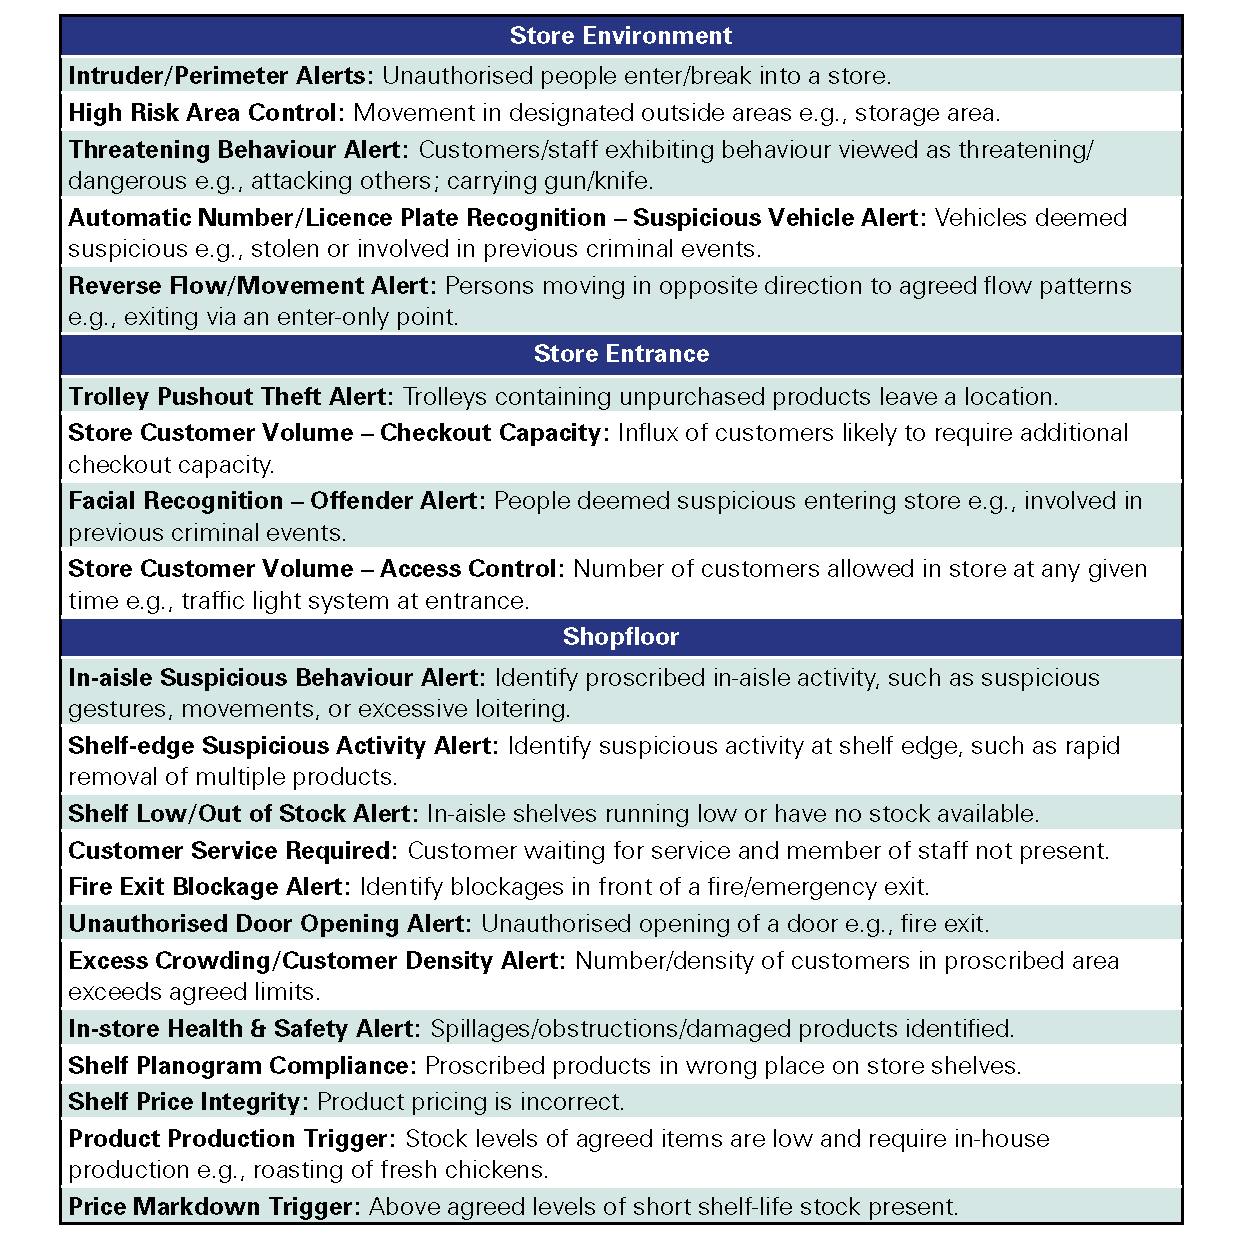
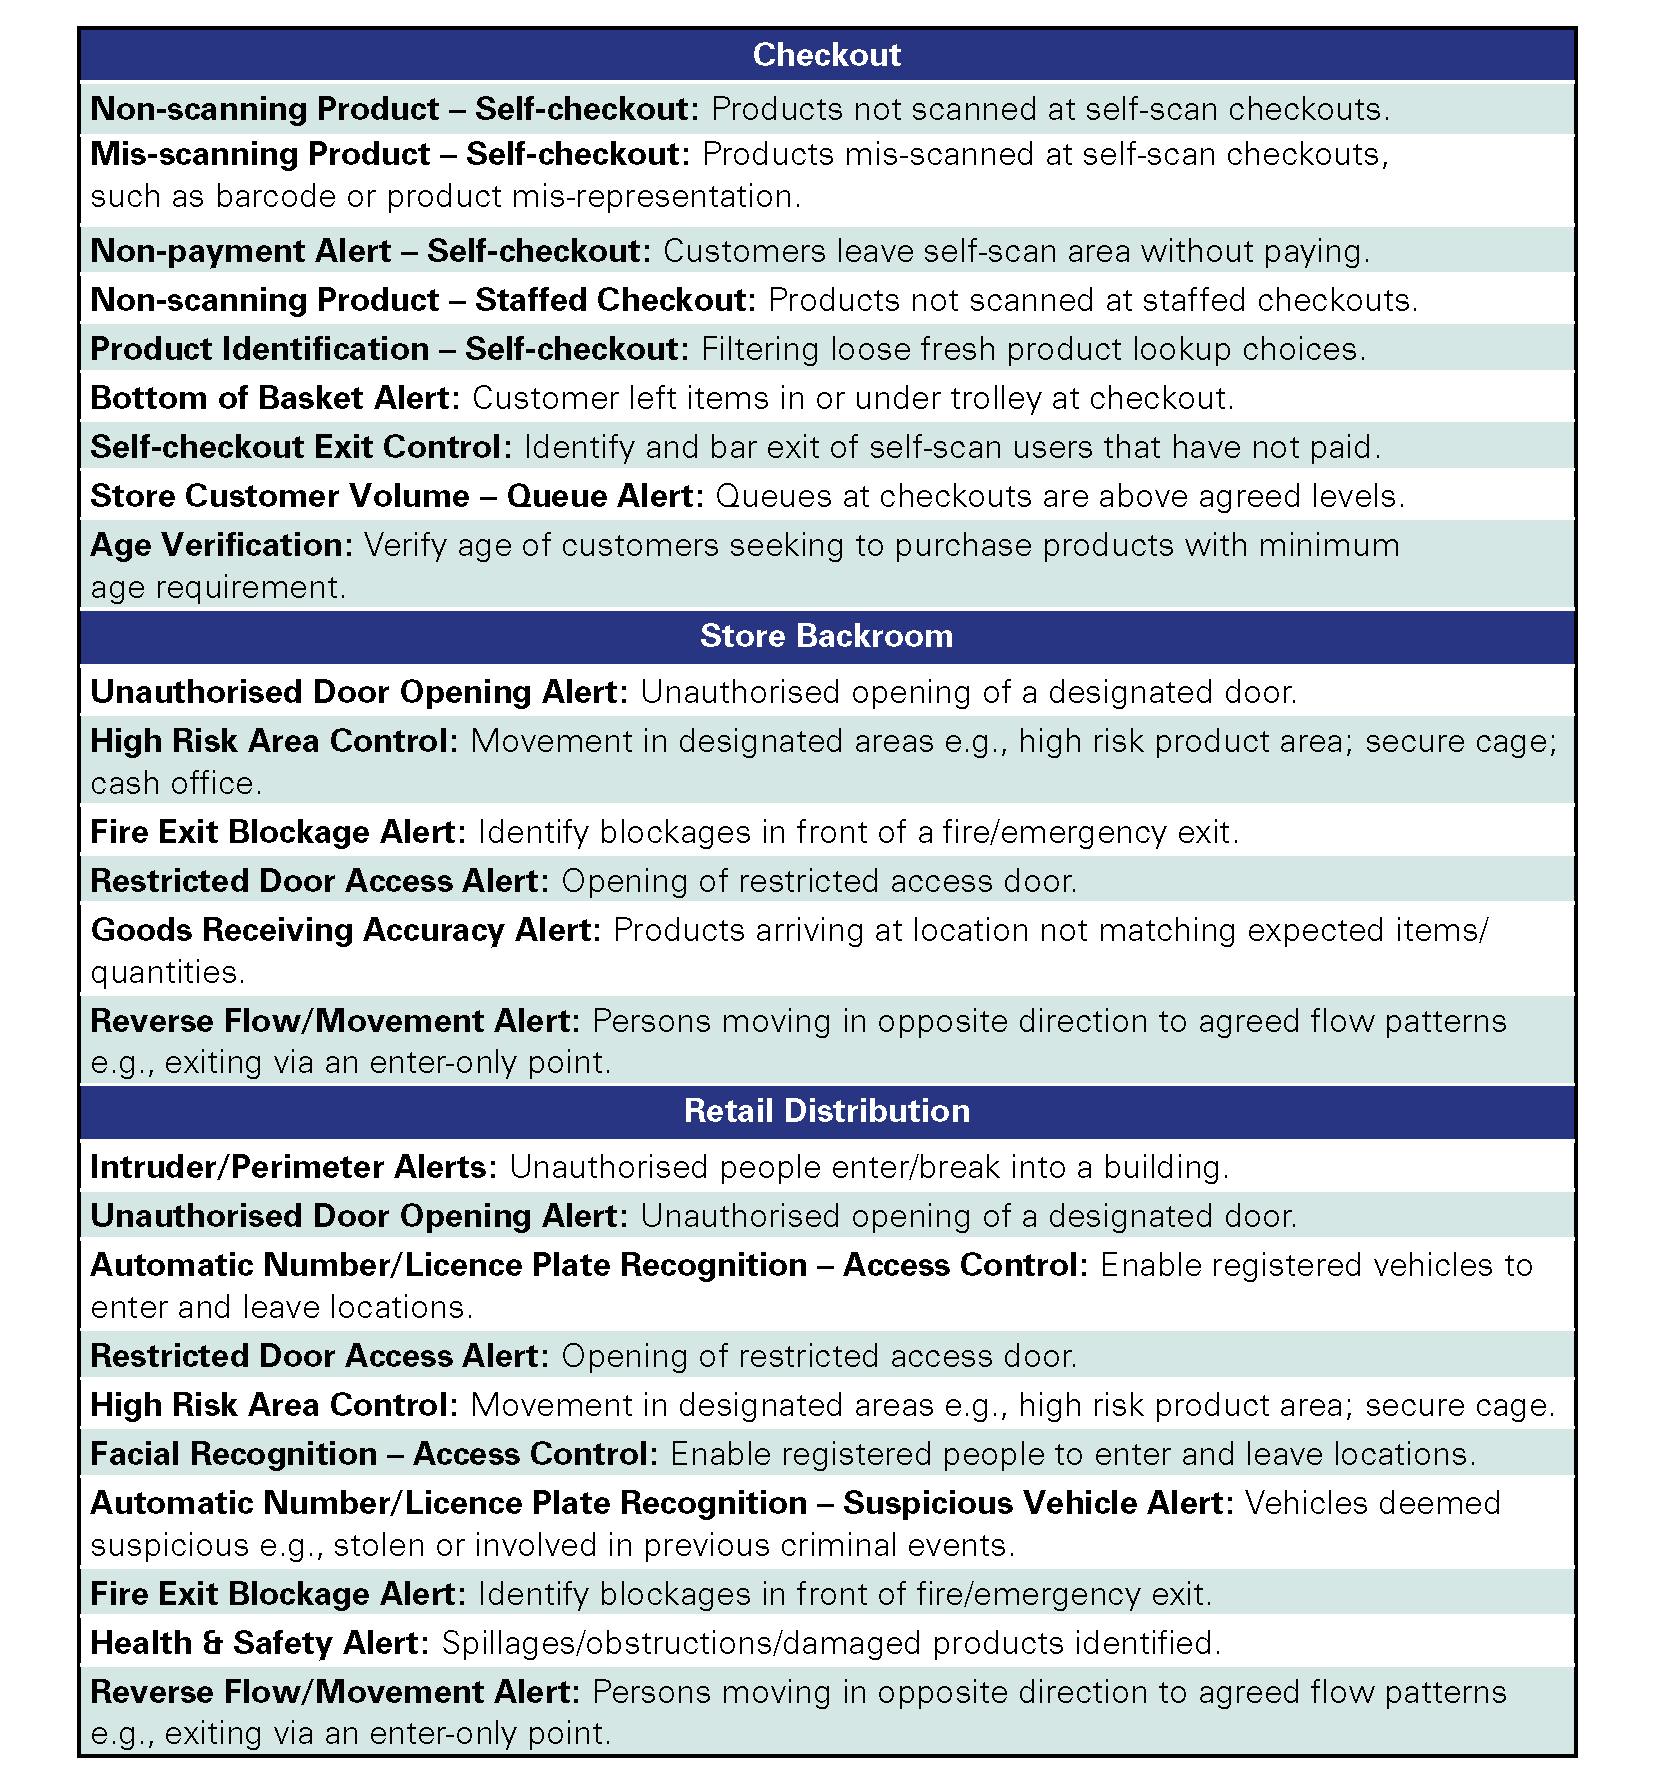
Appendix I
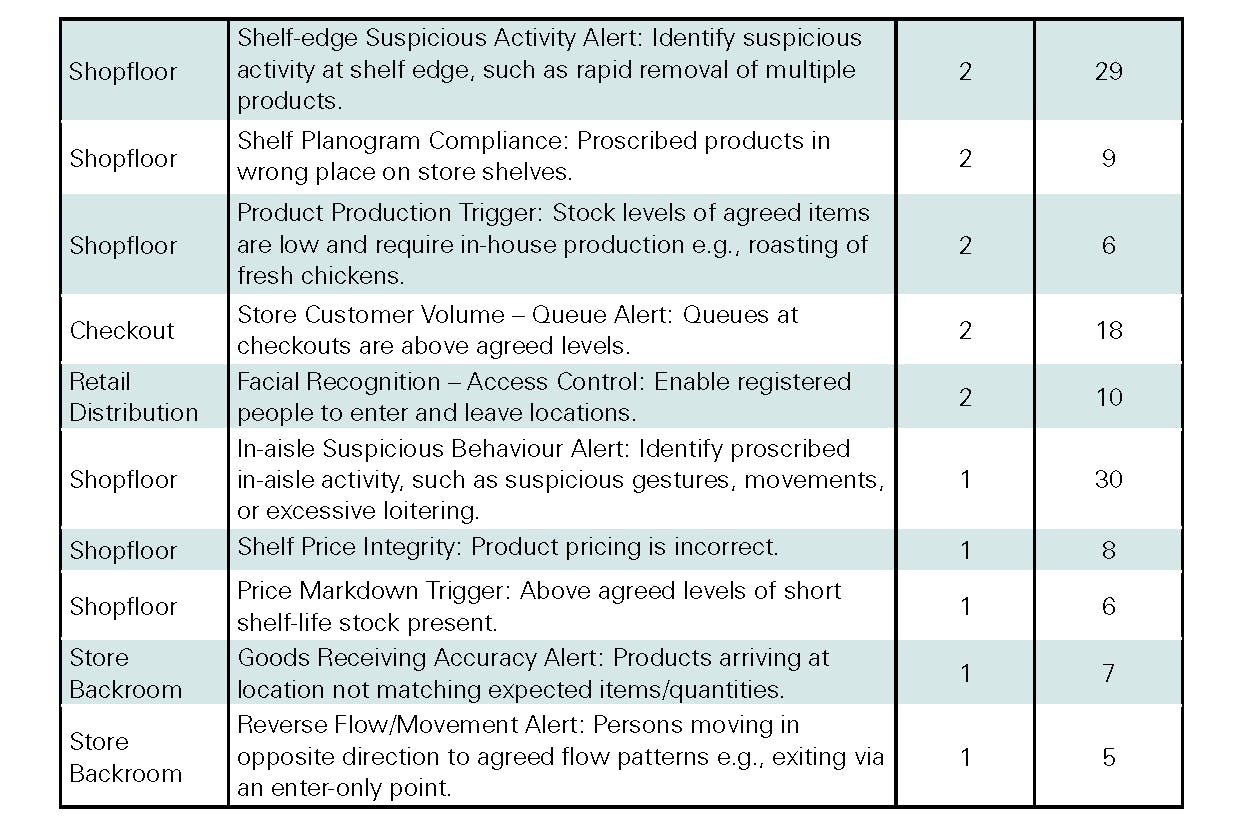
Types of Video Analytics
Detailed below are the various types of video analytics included in the survey, broken down by area of the retail supply chain where they are being deployed.
Appendix II
Rank Order of Deployment of Video Analytics

Appendix III
Video Analytic Utilisation Checklist


Main office
ECR Community a.s.b.l
Upcoming Meetings
Join Our Mailing List
Subscribe© 2023 ECR Retails Loss. All Rights Reserved|Privacy Policy