


A Proven Approach to Shrinkage Reduction
How adopting a systemic, systematic and collaborative approach has been proven to sell more and lose less
Table of Contents:
- Abstract
- Executive Summary
- Introduction
- Managing Shrinkage: A Missed Opportunity
- - Defining Shrinkage
- - Counting the Cost of Shrinkage
- - The Shrinkage Iceberg
- - Causes of Shrinkage
- - Lack of Co-operation
- - Problems of Managing Shrinkage
- Integrating Shrinkage into Corporate Policy
- - Traditional approaches to shrinkage management are crisis driven
- - Defining Accountability for Shrinkage Reduction
- - Responsibility for Shrinkage
- - Contextualise Shrinkage Against Corporate Objectives
- - Developing Detailed Measures of Shrinkage
- - Implementing Best Practice
- The Shrinkage Reduction Road Map
- - Step 1: Develop a Project Plan
- - Step 2: Map Key Processes & Gather Measures
- - Step 3: Analyse Risk and Identify Root Causes
- - Step 4: Develop Solutions and Prioritise Actions
- - Step 5: Implement and Trial Solutions
- - Step 6: Evaluate Implementation
- - Road Map Epilogue
- - Sonae and Colgate Palmolive
- - Sainsbury’s and a Consortium of Branded Spirits Suppliers
- - Tesco and Gillette
- - Wickes, Lloyd Fraser and GET
- - Coop Italia and Procter & Gamble
Languages :
This report, first published in 2001, with an updated version released in 2003, sets the stage for the ECR Retail Loss Group’s overarching philosophy of ‘sell more and lose less. It is based upon extensive research with a range of European retailers, including a series of case studies charting how businesses went about adopting this approach to better manage their retail losses.
The original printed version of this report includes a CD Rom containing the overall rationale for the ‘ECR’ approach together with a series of tools and techniques that retailers could utilise.
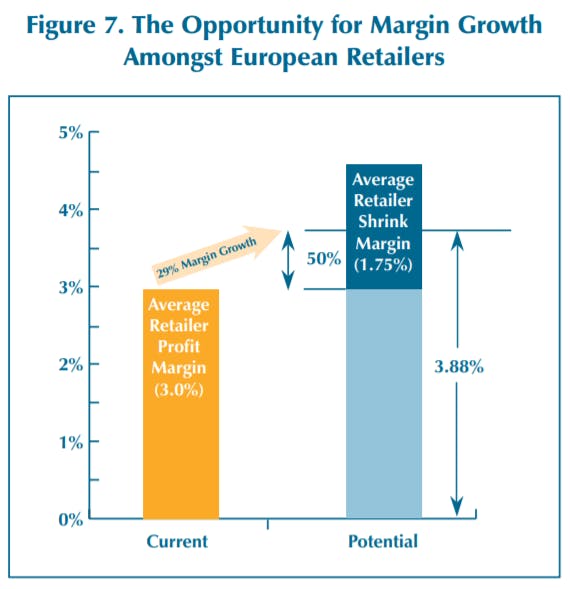
The report notes that average European retailer profits could be 29 per cent higher if they could reduce their losses through shrinkage by one half. In addition, it highlights some of the consequences of shrinkage, such as out of stocks and restricted product availability, which impact directly upon shopper satisfaction.
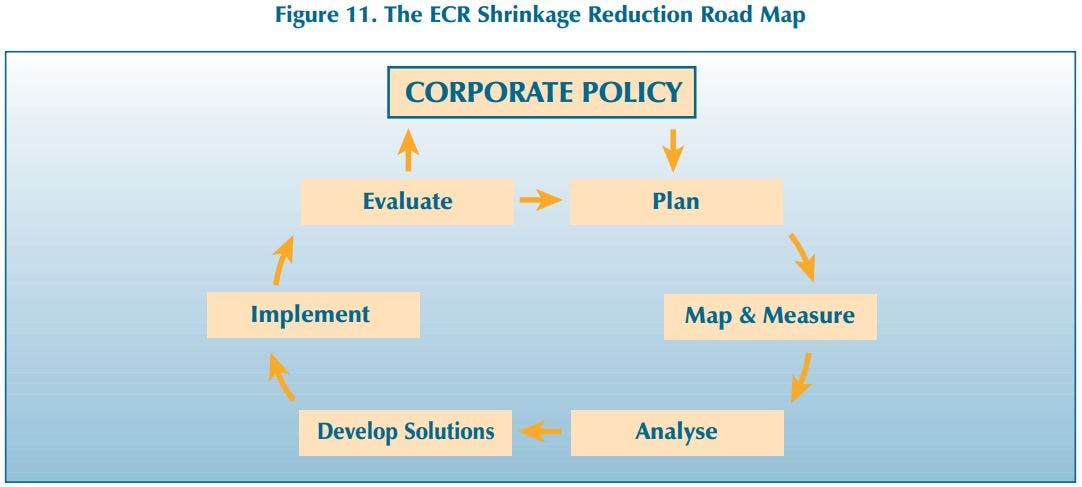
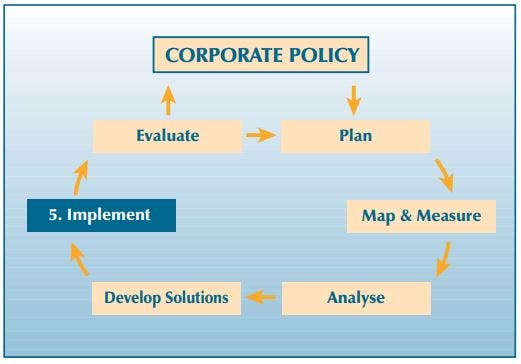
A central component of the report is the Shrinkage Reduction Road Map – an approach that is considered to be both systemic and systematic and designed to deliver real benefits to the companies using it. The Road Map is made up of six steps: 1) Develop a Project Plan; 2) Map Key Processes and Gather Measures; 3) Analyse Risk and Identify Root Causes; 4) Develop Solutions and Prioritise Actions; 5) Implement and Trial Solutions; and 6) Evaluate Implementation.
The Report stresses that it is important to recognise that the Road Map needs to be incorporated into a shrinkage reduction strategy that is itself fully integrated into the overall corporate policy of the company. Companies need to appreciate that unless and until companies give shrinkage management the same weight and importance as other functions within the business such as sales, distribution and marketing, they will continue to suffer unacceptably high levels of loss.
This seminal study goes on to argue that an integrated shrinkage policy that is committed to ongoing improvement, recognises the value of working with partners throughout the supply chain, and uses the ECR Road Map to deliver targeted solutions to particular problems, will make a significant contribution to the overall profitability of the business.
It concludes by suggesting that the application of this approach to managing shrinkage can bring companies a real opportunity to increase profits and increased customer satisfaction – a win-win outcome the FMCG sector.
Abstract
This report, first published in 2001, with an updated version released in 2003, sets the stage for the ECR Retail Loss Group’s overarching philosophy of ‘sell more and lose less. It is based upon extensive research with a range of European retailers, including a series of case studies charting how businesses went about adopting this approach to better manage their retail losses.
The original printed version of this report includes a CD Rom containing the overall rationale for the ‘ECR’ approach together with a series of tools and techniques that retailers could utilise.
The report notes that average European retailer profits could be 29 per cent higher if they could reduce their losses through shrinkage by one half. In addition, it highlights some of the consequences of shrinkage, such as out of stocks and restricted product availability, which impact directly upon shopper satisfaction.
A central component of the report is the Shrinkage Reduction Road Map – an approach that is considered to be both systemic and systematic and designed to deliver real benefits to the companies using it. The Road Map is made up of six steps: 1) Develop a Project Plan; 2) Map Key Processes and Gather Measures; 3) Analyse Risk and Identify Root Causes; 4) Develop Solutions and Prioritise Actions; 5) Implement and Trial Solutions; and 6) Evaluate Implementation.
The Report stresses that it is important to recognise that the Road Map needs to be incorporated into a shrinkage reduction strategy that is itself fully integrated into the overall corporate policy of the company. Companies need to appreciate that unless and until companies give shrinkage management the same weight and importance as other functions within the business such as sales, distribution and marketing, they will continue to suffer unacceptably high levels of loss.
This seminal study goes on to argue that an integrated shrinkage policy that is committed to ongoing improvement, recognises the value of working with partners throughout the supply chain, and uses the ECR Road Map to deliver targeted solutions to particular problems, will make a significant contribution to the overall profitability of the business.
It concludes by suggesting that the application of this approach to managing shrinkage can bring companies a real opportunity to increase profits and increased customer satisfaction – a win-win outcome the FMCG sector.
Executive Summary
There is an increasing recognition of the scale and extent of the problem of shrinkage in the FMCG sector. Current estimates suggest that in Europe alone it accounts for €18 billion a year. There is also a growing realisation that existing approaches to tackle this problem have been piecemeal, partial and largely ineffective. As we outline in this book, on average European retailer profits could be 29 per cent higher if they could reduce their losses through shrinkage by one half. In addition, some of the consequences of shrinkage, such as out of stocks and restricted product availability, impact directly upon shopper satisfaction.
Over the past three years the ECR Europe Shrinkage Group has developed a new approach to tackling the problem of stock loss, based upon genuine inter-company collaboration throughout the supply chain. The outcome of this work has been the development of the Shrinkage Reduction Road Map – an approach that is both systemic and systematic and designed to deliver real benefits to the companies using it.
It is important to recognise, however, that the Road Map needs to be incorporated into a shrinkage reduction strategy that is itself fully integrated into the overall corporate policy of the company. Companies therefore must appreciate that unless and until they give shrinkage management the same weight and importance as other functions within the business such as sales, distribution and marketing, they will continue to suffer unacceptably high levels of loss.
An integrated shrinkage policy that is committed to ongoing improvement, recognises the value of working with partners throughout the supply chain, and uses the ECR Road Map to deliver targeted solutions to particular problems, will make a significant contribution to the overall profitability of the business.
The case studies presented in this Blue Book offer real examples of how the Road Map can be used to develop and deploy end to end solutions – it has been tried and tested to show it is practical, easy to use, robust and capable of delivering results in just a few weeks. Detailed in this book and the accompanying CD is the rationale for adopting this approach and the tools and techniques that can be used to implement the Road Map
Above all, the application of this approach to managing shrinkage can bring companies a real opportunity to increase profits and customer satisfaction – a win-win outcome that should make this Blue Book essential reading for the FMCG sector!
Introduction
The aim of the ECR Europe shrinkage project was to identify the scale and extent of stock loss in the Fast Moving Consumer Goods (FMCG) sector, and develop a joint vision on how retailers, manufacturers and distributors could work together to reduce the problem of shrinkage.
In recognition of the complex nature of the stock loss problem, two academic organisations were selected to manage the research programme. The University of Leicester was chosen for their expertise in the area of security and retail crime while the Cranfield School of Management was chosen for their specialism in the field of supply chain management and logistics. Working together these two groups of experts have combined their knowledge to bring fresh thinking to the FMCG sector in an effort to achieve a coherent and comprehensive approach to tackling stock loss. This study breaks much new ground with the first pan-European study of stock loss in the FMCG supply chain and the development and validation of the Road Map – a collaborative and systematic approach to reducing stock loss.
This report is intended to be a concise document, focused on convincing the industry to adopt the Road Map. It draws on an earlier report by the University of Leicester dealing with the size and nature of the stock loss problem within the FMCG sector, based upon a pan-European survey of retailers and manufacturers1 , and research carried out by Cranfield School of Management on the supply chains of 23 European companies.
If collaborative efforts are increased, the industry could start to reduce its losses significantly
Looking forward there is good reason to believe that collaborative efforts, guided by the Road Map, can contribute to total systems efficiency throughout the supply chain. While the evidence shows that there are opportunities for increased internal collaboration in all areas of the supply chain, it is the collaborative efforts between retailers, distributors and manufacturers working to reduce stock loss within retail stores where the most impact is likely to be made. Companies along the supply chain need to work together to identify improvements in a wide range of areas including: product design, packaging, administration, logistics, stock control, replenishment planning, stock room management, store layout, shelf design and people management. Getting it right requires teamwork, a structured approach and hard data on the extent and nature of stock loss throughout the entire supply chain: a paradigm shift away from where many companies are today. But if this is done, all parties, not least the shopper, who will see greater availability and choice on the shelf, will benefit. This in turn will increase sales and profits for both retailers and manufacturers.
Getting it right will require teamwork, a structured approach and hard data on the extent and nature of stock loss throughout the entire supply chain
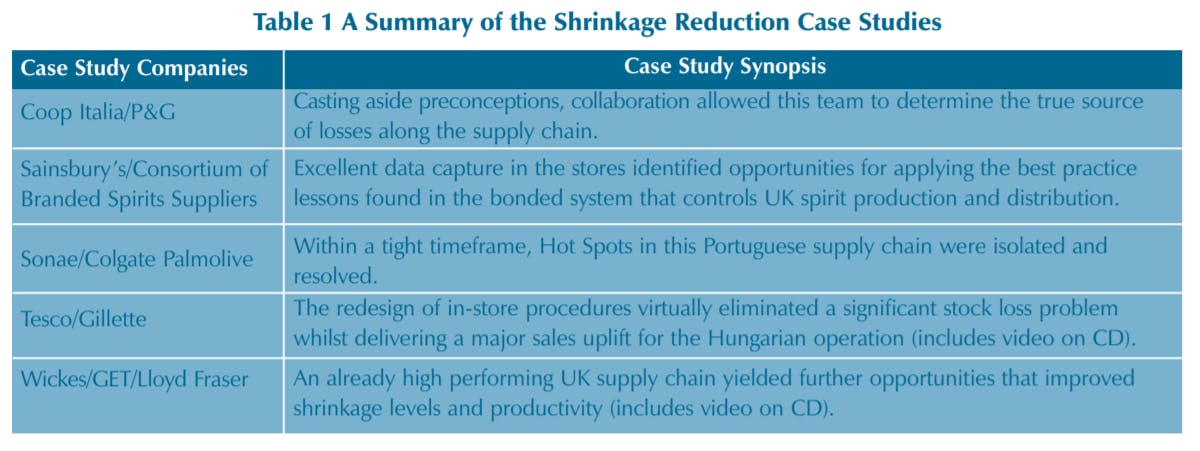
A CD-ROM accompanies this ECR Blue Book. This contains material that provides practical assistance for teams undertaking a loss reduction project. This includes tools and techniques that help the team follow the steps in the Road Map and come in various forms, including questionnaires, checksheets and spreadsheets. The CD also includes a series of case studies taken from projects carried out by companies in the ECR movement, consisting of a presentation from the project teams. It also includes two videos. A brief synopsis of each case is presented in Table 1 overleaf.
Managing Shrinkage: A Missed Opportunity
Defining Shrinkage
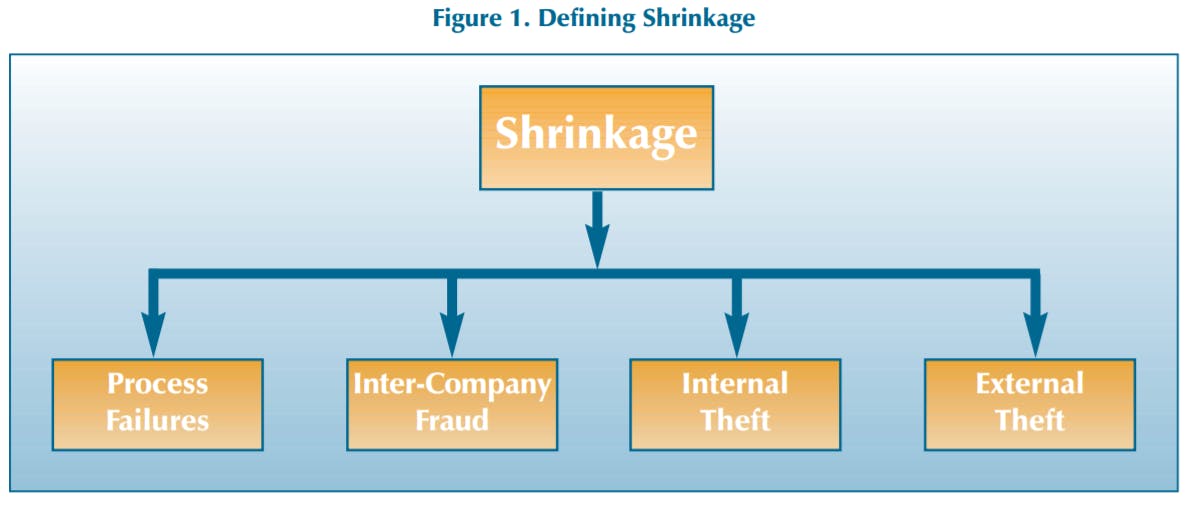
In order to resolve shrinkage, it is important to have clarity about what it is. The ECR team considers shrinkage as consisting of four elements, as shown below.
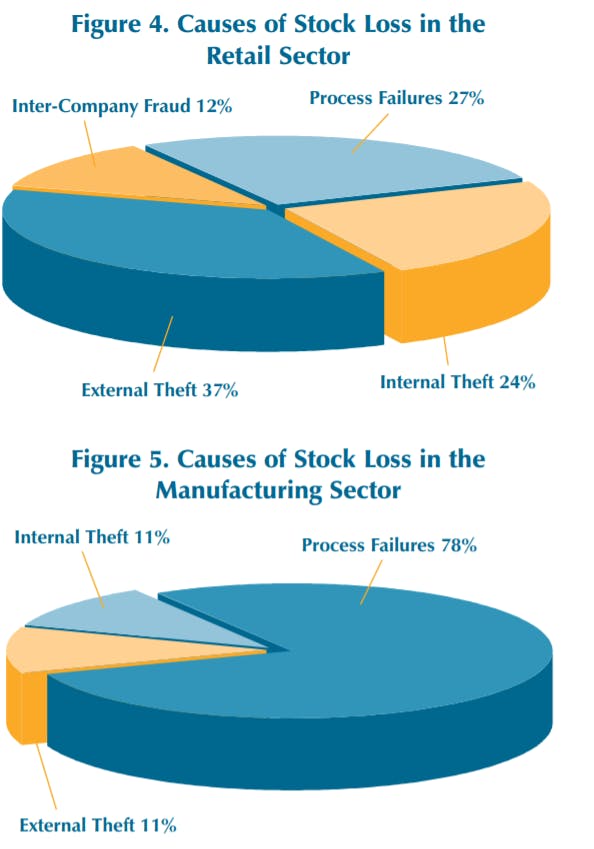
Process failures can occur in the physical flow of goods along the supply chain, in information systems or in finance systems. The effect of failure in any one of these systems is that stock will be lost and/or payment for goods is incorrect. When considering fresh product, process failure is likely to be the biggest cause of shrinkage. Inter-company fraud leads to shrinkage when trading partners intentionally deliver the wrong quantities and/or charge for goods to their advantage. This tends to occur when poor processes, procedures or controls are exploited. Whilst the effect is similar, theft is categorised as being either internal, e.g. by employees or contracted staff, or external, e.g. shop thieves or burglars. The ways theft occurs can vary significantly although in many instances it is a consequence of poor processes, procedures or controls within a company. Theft accounts for a significant proportion of shrinkage in the FMCG sector with ‘Hot Products’2 being particularly vulnerable.
Counting the Cost of Shrinkage
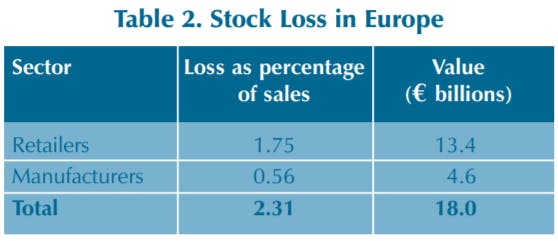
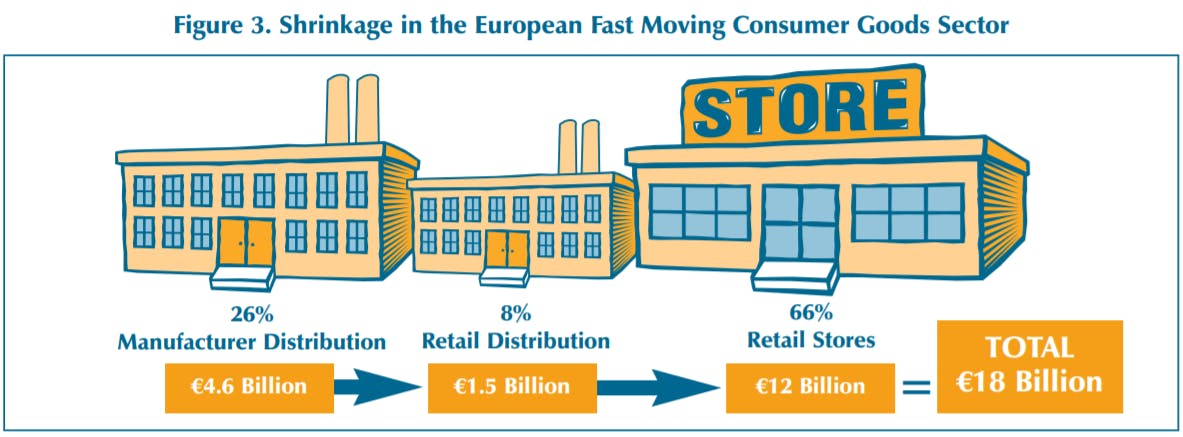
The FMCG sector in Europe is big business with a combined market turnover of over €820 billion. The groundbreaking research carried out on behalf of ECR Europe showed that shrinkage is a major threat to the efficiency and effectiveness of the sector. In 2000, retailers lost €13.4 billion due to shrinkage, equating to 1.75% of turnover or €258 million a week. Manufacturers are not immune from this problem and lost €4.6 billion, accounting for 0.56% of turnover or €89 million a week. Taken together, the FMCG sector is haemorrhaging €18 billion a year due to stock loss. In addition, retailers alone are spending €2.14 billion trying to tackle this problem. The impact on profitability is dramatic and retail profits could be 29% higher if companies reduced losses due to shrinkage by 50%.3
The FMCG sector is losing €50 million a day due to shrinkage. Annually this is equivalent to the GDP of Luxembourg
The FMCG sector is highly complex with many manufacturers having logistical webs covering all of Europe, while many retailers have product ranges between 40,000-250,000 SKUs. Research shows that all points of the logistical chain are vulnerable to loss not just the retail store. In 2000, €6.1 billion of stock was lost even before it made it to stores.
The Shrinkage Iceberg
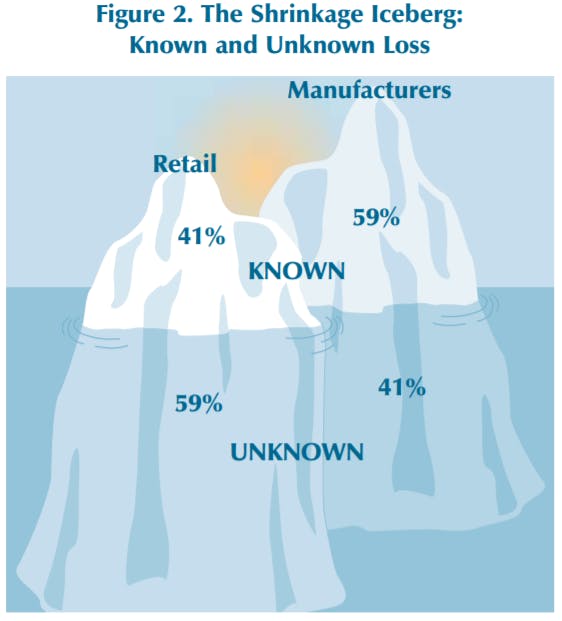
Information on stock loss is shrouded in ignorance and hearsay. At best, company information on this problem is partial and incomplete and at worst non-existent. Research carried out for ECR Europe found that most retail companies do not know where, how or when the majority of their losses occurred. Manufacturers can only boast a slightly better record although even they cannot account for over 40% of their losses. In 2000, retailers were unable to explain how €7.9 billion of stock was lost, while manufacturers were unable to pinpoint how €1.9 billion of their products ‘disappeared’. Taken together, the FMCG sector cannot account for nearly €10 billion of stock.
Gathering high quality data that is reliable, timely and complete needs to be a priority for any future stock loss reduction strategy. At the moment, while a number of companies regularly collect computerised information on process failures, very few keep track of all the shrinkage threats, in particular theft. If a problem is not recorded and analysed, it is highly unlikely that it will be understood or tackled effectively. Retailers and manufacturers do not know where, how or when they lose €192 million a week.
Without doubt, a paucity of data plays a pivotal part in producing poor product protection
Causes of Shrinkage
Highlighting how stock is lost is a vital part of any effective stock loss reduction strategy – it can identify priorities and enable responses to be tailored to specific needs. The research showed that for retailers, the biggest perceived threat came from theft – over €8 billion or over 60% of all stock loss was thought to be due to staff and ‘customers’ thieving from their organisations. Process failures were seen as the next major cause of shrinkage – €3.6 billion lost due to products being ‘misplaced’ in the supply chain, getting damaged or going out of date. For manufacturers, the biggest culprit was process failures with over three-quarters of all losses being seen as a consequence of this. For them theft was less of an issue although it still accounted for over €1 billion of loss in 2000. Theft is thought to account for over €9 billion of loss in the FMCG sector
Lack of Co-operation
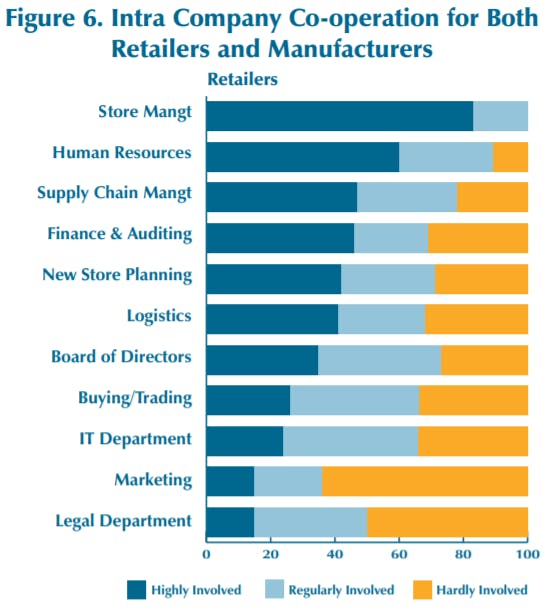
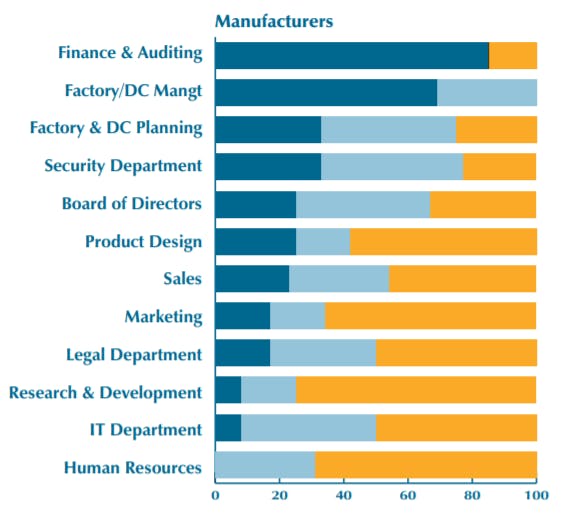
Shrinkage is a problem that transcends departmental and company boundaries – it is a common problem requiring shared solutions. The ECR Europe research showed a lack of cooperation not only within companies, but also between companies who are involved in the supply chain. For the most part retailers see stock loss as the exclusive responsibility of the security/loss prevention and audit departments, and store management, while manufacturers tend to put the onus upon the logistics team to deal with this problem. Few other departments are highly involved, with retailers rarely involving buyers, marketing, the IT department or indeed the Board of Directors. Similarly, manufacturers rarely make use of the research and development team, sales and marketing or human resources.
The picture is even gloomier when inter-company co-operation is considered. For retailers, the current climate is characterised by an emphasis on reactive collaboration with security providers and the police. Relatively few pointed to work with individual manufacturers or their representative organisations. Manufacturers were even more isolated with less than 1 in 3 working with individual retailers on issues of stock loss and most focusing their co-operative efforts on third party logistics service providers.
Problems of Managing Shrinkage
The management of shrinkage has suffered from a number of inter-related problems that have combined to limit its effectiveness in dealing with an issue that is costing businesses billions of Euro a year both in terms of losses and expenditure on so called ‘solutions’.
Unfortunately Necessary
Shrinkage management suffers from an image problem within organisations. Too often it is not seen as actively contributing to bottom line profitability. It is seen as a regrettable consequence of doing business or a function that can be called upon when things have gone badly wrong, such as a break-in, when products have been contaminated or a member of staff has been attacked. To this end, it is often seen as the task that requires skills similar to those used in public policing, i.e. detaining offenders and employing guards.
Juggling Priorities
The roles and responsibilities of security/loss prevention departments are often many and varied, ranging from issues of health and safety, through monitoring contract guarding companies, to responding to kidnap attempts on senior members of the organisation. Some of this myriad of duties are statutory requirements. Non-compliance can result in substantial penalties, which means that stock loss receives a lower priority from those people tasked with its management.
Solutions Searching for a Problem
Many of the methods and approaches currently adopted by shrinkage managers focus on one particular problem: shoplifting, coupled with an almost obsessive belief that the answer can be found in a quick fix technological panacea. As the data presented above has shown, retail shrinkage managers themselves suggest that only about onethird of loss is caused by external theft, and yet as one senior manager put it: ‘tackling shoplifting accounts for about 95 per cent of our security budget’. In addition, security services and technology providers have been able to drive the stock loss agenda on a ‘we have a solution, can we now find a problem’ basis.
‘Tackling shoplifting accounts for about 95 per cent of our security budget’ (Senior Retail Manager)
Myopic Management
Many shrinkage practitioners have a tendency to see the problem as only occurring at the end of the supply chain – after the products eventually reach the store. This is in part a function of the prioritisation of shoplifting as the primary cause of stock loss. The store is the point at which customers interact with the products and where many of the current technology ‘solutions’ are most easily applied. But as shown above, up to one third of loss takes place before the goods have reached the retail outlet, highlighting the need to look at losses of goods in transit and while being stored in distribution centres. Certainly the stores are a very vulnerable part of the supply chain, but they are only a part of the chain and stock loss practitioners need to look beyond the retail outlet and recognise that good loss prevention is about securing the entire supply chain.
Time to Take Action
The research carried out for ECR Europe clearly shows that to date the FMCG sector has neglected the problem of shrinkage and its effective management. It is a sector suffering enormous losses, lacking any detailed understanding of the extent and nature of the problem, with existing approaches tending to be ad hoc, piecemeal, partial and lacking in intra- and inter- company cooperation. It is time for the FMCG sector to act and tackle this problem through a systematic and coordinated approach. The consequence of not doing this is an ever-increasing bill for shrinkage, which currently stands at €18 billion per year.
Integrating Shrinkage into Corporate Policy
Recent research carried out by ECR Europe examined the causes of shrinkage, looking at 12 FMCG supply chains. Each supply chain was investigated from supplier right through to the shelf in the retailers’ store. A key phenomenon observed in the approaches adopted to tackle shrinkage was that they tended to be crisis driven – resource and attention was only applied when a significant event had occurred or extraordinary levels of loss had come to light. The response was ad-hoc and usually driven by a series of well-worn anecdotes – ‘shoplifters must be the problem’.
This research also showed that while a multitude of alternative solutions to shrinkage exist, loss prevention specialists often prioritised those that involved the use of technology. In addition, it was found that efforts to reduce shrinkage typically failed to consider the impact they have on other business objectives, for instance sales, stock availability and customer satisfaction. Solutions were often imposed unilaterally by one party in the supply chain without considering the impact on other groups; something which is clearly at odds with the collaborative approach supported by ECR.
Finally the implementation of solutions was not followed by an analysis of their effectiveness – there was little evidence of the collection of hard data on what impact the intervention had had within the supply chain. In stark contrast to good practices observed elsewhere in the FMCG industry, shrinkage reduction cannot claim to be part of the ‘knowledge economy.’ The lack of data on the impact of previous shrinkage solutions therefore undermines the ability of businesses to make sound business decisions. When the next crisis occurs the old cycle continues: ad-hoc reactions based on anecdotes emphasising the problem of shoplifting and the usefulness of technology-based solutions.
Traditional approaches to shrinkage management are crisis driven
In order to break out of this cycle, the management of shrinkage needs to be fully integrated into overall corporate policy, giving it the same weight and importance as other functions within the business such as sales, distribution and marketing. In addition, it needs to develop a corporate shrinkage policy that extends beyond the company to effectively incorporate all supply chain partners. An integrated shrinkage policy needs to be properly resourced, it needs appropriate channels of accountability and it needs to incorporate the mechanisms to capture high quality shrinkage data so that key performance indicators can be developed and the value of solutions assessed.
Through adopting such an approach, companies are far more likely to develop and deploy best practice in reducing shrinkage throughout the supply chain. This Blue Book is designed to help with this process. The ECR Shrinkage Reduction Road Map described in detail later in this book is a tried and tested tool to help companies to develop a corporate shrinkage strategy committed to ongoing improvement and recognised as contributing to the overall profitability of the business. The key components of developing an integrated shrinkage policy are outlined below.
Defining Accountability for Shrinkage Reduction
To deliver the opportunity that shrinkage reduction presents for profit enhancement, there needs to be a senior manager or ‘champion’ accountable for it. This person co-ordinates the development of the shrinkage policy, ensuring that the knowledge and experience of stakeholders from across the supply chain are incorporated. They then oversee its management within their company and ensure collaboration with supply chain partners. More specifically, this person ensures the following actions are undertaken:
- Set and agree policy:
– Internally with the senior management team.
– Externally in collaboration with supply chain partners.
- Set KPIs:
– Identify the metrics needed to make informed decisions on shrinkage issues.
– Design a system to collect and collate the necessary information.
- Allocate responsibility to deliver the policy:
– Collect data.
– Research/mine data.
– Plan and undertake actions to reduce loss.
- Monitor performance and adherence to the policy and revise as appropriate.
These activities require resources and naturally no management team should make such a commitment lightly. However the ECR research found that companies employing dedicated security/loss prevention departments and audit departments suffered much lower losses due to shrinkage. For those retailers with a security/loss prevention department, the level of stock loss was 27% lower. Similarly, manufacturers with such a specialist department also benefited from significantly lower levels of loss. The impact of dedicated audit departments was even more dramatic – retailers with such a function had losses 39% lower than those companies without such a department. Once again, this picture was mirrored in the data from manufacturers. It was also found that having the opportunity to report directly to the Board of Directors significantly improved the performance of these specialist teams. The conclusion is that having specialist teams that report directly to the Board of Directors can significantly reduce losses from shrinkage.
Responsibility for Shrinkage
Whilst it is necessary to assign accountability for delivering results at a senior level in the organisation, responsibility for undertaking the tasks necessary to reduce losses should be devolved to operational managers throughout the organisation. Stock loss is a cross-functional problem and examples of poor management that lead to stock loss can be seen in most areas. For example:
- Logistics managers failing to follow receiving and dispatch procedures.
- Operations managers storing vulnerable products in locations that are difficult to supervise.
- HR managers failing to carry out routine checks on new employees.
- Facilities managers failing to liase with architects to design out well-known problems in store layout and warehouse design.
- Product designers failing to ensure packaging protects its contents.
- Category mangers failing to set up product attributes correctly.
- Sales managers overstocking shelves and promoting vulnerable products without considering the impact on losses.
It is therefore necessary for managers in these and all other functions to be aware of their responsibility to reduce shrinkage. Their roles should therefore include an obligation to collate and act upon data on stock loss within their sphere of influence. Results from action to resolve outstanding issues are then reported up the management structure to the person accountable for shrinkage.
Contextualise Shrinkage Against Corporate Objectives
Successful shrinkage management requires it to be recognised and prioritised as a key component within the objectives of the corporation. To be effective, shrinkage results should be communicated regularly at board level, not hidden from view amongst the general cost of doing business. Shrinkage justifies this need for managerial attention because of two factors:
- Impact of shrinkage on corporate results.
- Impact of shrinkage on shopper satisfaction.
Impact of Shrinkage on Corporate Results
Shrinkage thwarts the efforts of retailers and manufacturers to deliver their financial objectives as the cost of shrinkage is both significant and has a negative impact upon sales. Considering the cost of shrinkage, the most significant element is typically the cost of lost stock. Described in detail earlier, it is worth recapping that the FMCG sector is losing 2.31% of the value of its turnover to shrinkage. The significance cost of shrinkage becomes clearer when considered in terms of retailer profitability. A review of 25 European supermarket chains’ annual reports for year 2000 revealed an average profit margin of 3%, while the cost of shrinkage was calculated at 1.75% of turnover. If the cost of shrinkage was halved, the retail sector could increase its average profitability from 3% to 3.88%, a growth of nearly one-third (Figure 7).
In addition to this figure is the cost of responding to shrinkage through a variety of loss reduction measures, including the installation of equipment, employing security personnel, adding checks to procedures, and the cost of managerial effort required to implement and supervise these measures. The ECR survey estimated that this costs FMCG European retailers and manufacturers approximately €2.1 billion a year.
Impact of Shrinkage on Shopper Satisfaction
Shrinkage can negatively impact upon customer satisfaction in two key ways: by causing out-ofstocks (OOS) at retail outlets; and restricting access to goods that retailers perceive to be at high risk from shrinkage.
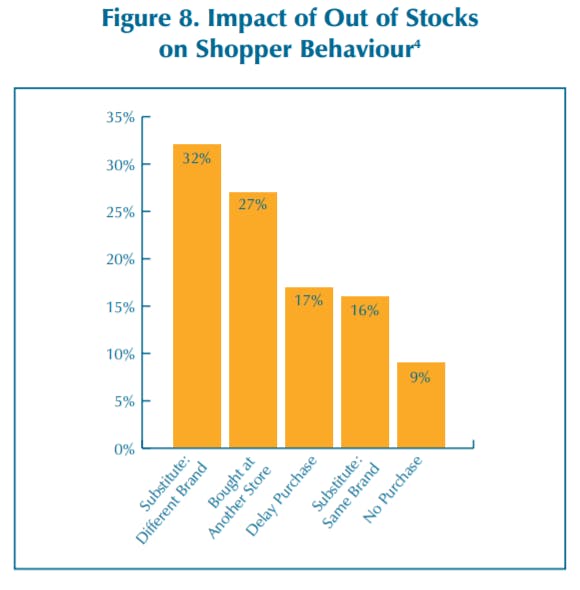
Automatic stock management systems use sales data to determine when to replenish a store. Shrinkage can cause shelves to become empty before the reordering point is reached. Without any stock on the shelf, no sales are made and so the reordering point is not reached. This causes the shelves to remain empty until the time either a manual order is generated or the inventory record is corrected. Shopper inconvenience and inconsistent on-shelf-availability negatively impacts upon the relationship between consumers, their preferred products and their preferred retail outlets. Even occasional gaps in availability can diminish loyalty, which may increase shoppers’ propensity to permanently switch product or store (see Figure 8).
Shrinkage also has an impact on shopper satisfaction by restricting product choice and convenience. The range of products carried by a retailer may be restricted where they perceive that the threat of shrinkage is too high. For example shoppers may want to buy DVDs along with their regular shopping but the threat of losses in this category may cause a grocery retailer not to stock them. Similarly, a retailer may feel that the sale of certain fresh products are too unpredictable, leading to product going out of date, and so they decide to limit their range. In addition, retailers may take items from open sale if they perceive the threat of shrinkage to be too high. This often involves relocating the product away from the usual aisle and locking them away. Shoppers often interpret an empty shelf as meaning the store is out of stock, whether there is a sign explaining the situation or not, so they behave accordingly. Where they recognise that they must look elsewhere for the product, the shopper may have to find a member of staff to serve them. This goes against the common practice of self-service retailing and is not to the liking of many shoppers. This can lead to them displacing their purchase to another product or another store or going without. It is unlikely that any of these conclusions increases shopper satisfaction.
Shrinkage impacts on shopper satisfaction by restricting product choice and convenience
Developing Detailed Measures of Shrinkage
Resolving shrinkage would be a simple matter were it possible to identify incidents at the time they occur and a person was accountable for responding to it and resolving the problem. The lesson that can be drawn from this cosy scenario is that before it is possible to act to resolve shrinkage it is necessary to determine what and how many items are being lost, where the losses are occurring and when.
Defining Shrinkage
Opinions vary on a definition for shrinkage. Some take a very narrow perspective and limit it to the loss of stock only, choosing to exclude the loss of cash from an organisation, or consider it to relate only to the losses that cannot be explained – ‘unknown losses’ as they are usually referred to. At the other end of the spectrum, some argue for a much more inclusive, broad ranging definition which encompasses both stock and cash, as well as the losses that result from shrinkage events – ‘indirect losses’ – such as out of stocks caused by shop theft, the sale of stolen goods on the ‘nonretail’ market or the production of counterfeit products. In addition, some feel that the expenditure incurred responding to stock loss should also be included in the overall cost of shrinkage.
As detailed earlier, the ECR Europe Shrinkage Group has developed a definition that has received relatively broad acceptance, which strikes a middle ground between the two, driven in part by the current limitations imposed upon the ability to accurately measure the impact of shrinkage upon organisations. It is based upon four categories of shrinkage encompassing both stock and cash and made up of inter-company fraud, internal theft, external theft and process failures.
Measuring Shrinkage
In order to get rigorous and robust data on the nature and extent of shrinkage within a business, the key questions of Where? What? How much? and When? need to be answered.
Where: Losses are not evenly spread across the supply chain. The location where they occur should be determined by measuring the loss at each separate site, including individual distribution centres and stores. More detailed measures are also needed within sites to determine the exact location of failures in the supply chain. These measures can be gathered by various means including taking random samples, for example the accurateness of a DC picking operation can be determined by assessing the accuracy of picked items on randomly selected pallets.
What: Losses are not evenly spread across all products. Even within a particular category or product range the overall loss will be concentrated on certain items. It is therefore necessary to collate data on losses by stock keeping unit (SKU) or reference.
How much: In order to determine the direct cost of shrinkage for a given time period, the value of items and/or cash lost must be captured. This figure is expressed as a percentage of sales value, by using the following formula:
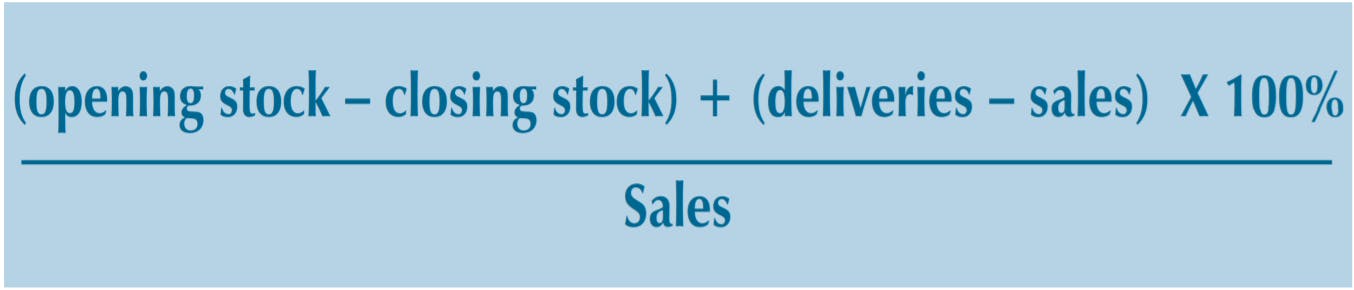
When: The frequency that measures are taken determines the ability to identify when losses occur. By measuring stock levels at the start and again at the end of a time period and then subtracting sales from recorded deliveries provides a measure of stock loss over a given period. The most common measurement interval is annually. This normally coincides with the annual stock-take in a business, which is necessary for accounting purposes. This allows a company to determine it’s annual stock loss. However it is not possible to specify the point in time over that year when losses occurred. Reducing the time period for undertaking this calculation narrows the time-window in which the loss could have occurred and increases the likelihood of understanding who was responsible and where it took place.
In order to understand the nature and extent of shrinkage, the key questions of Where? What? How much? and When? need to be answered
CASE STUDY EXAMPLE 1
In the Sainsbury’s BWS Case Study, data was gathered at the following intervals:
- Diageo’s DC counts inventory in a storage location the day after it had been moved.
- Allied Domecq’s DC ‘blind checks’ the inventory in a pick location every time product is picked from it.
- Sainsbury’s stores count their spirits every morning.
In each of these three operations, information is gathered very frequently. Where losses are found to occur it is therefore possible for the person accountable for stock loss to investigate each incident and act to resolve it.
Methods for Data Analysis
Having gathered the stock loss data it is necessary to determine the causes of losses in order to take action to reduce future problems. Not all causes of stock loss are easy to determine. Many occur intermittently and prove difficult to uncover. Thorough research of the causes of loss often requires the in-depth analysis of a large amount of data. This may need to be collated from a variety of sources and locations over an extended period of time.
The ECR research found that within the FMCG sector, most retailers keep records of inter-company fraud and process failures, but few kept computerised records of internal and external theft, either at a company or store level. Manufacturers were found to keep computerised records of process failures, but few recorded any form of theft on a computerised system. The majority kept either no record whatsoever or only paper files. It is only through the use of computerised databases that trends can be identified and a more informationled strategic approach can be adopted to deal with all the elements that account for shrinkage.
It is clear that the methods used to store and communicate information need to be rigorous, robust and reliable. For example, in order to determine which stores in a retail chain are responsible for a disproportionate amount of loss it is necessary to collect loss metrics in a common way, capture this information electronically and store it centrally.
Implementing Best Practice
At the heart of any corporate policy is the need for a business to make sufficient profit to ensure its survival. Europe’s €18 billion stock loss problem presents a substantial opportunity to achieve this most basic of aims. Adopting available best practice has the potential to make a significant contribution to releasing this opportunity for all the sectors’ stakeholders including shoppers, retailers and manufacturers.
Lessons learnt from the ECR case studies identify the following practices as ones that help organisations deliver improvements and that appear to have universal applicability in a range of different circumstances:
- Take a collaborative approach to reducing shrinkage.
- Focus effort on Hot Products; Hot Stores; and Hot Spots in the supply chain.
- Capture and share best practice.
Take a Collaborative Approach to Reducing Shrinkage
At the core of the ECR movement is the advancement of robust management methods in retailing. In loss prevention this means informationled decision making in collaboration with supply chain partners. Operationalising this approach requires the systematic investigation of the root causes of shrinkage. Undertaking this along the supply chain brings a holistic approach to the problem. A prerequisite for success is to have a commitment to collaboration between manufacturers, logistics service providers and retailers along the supply chain. Therefore companies should seek to drive the delivery of these benefits on two fronts:
- Throughout their organisation.
- Across the supply chain.
Collaboration within a company provides the means to resolve problems beyond the scope of individual functions to solve.
Methods used to store and communicate information need to be rigorous, robust and reliable
Collaboration is therefore necessary between departments, such as operations, buying, logistics, marketing, IT, security and finance.
Likewise, collaboration between companies resolves problems that are beyond the scope of separate companies to solve. Inter-company collaboration within the ECR movement traditionally involves vertical supply chain partners working together, i.e. customers and suppliers. As the ECR shrinkage case studies show collaboration should extend to include logistics service providers as well. Collaboration can also be amongst competing organisations, for example where they work within the remit of a trade body to resolve common issues.
The results of this work will be to:
- Design loss prevention solutions into the fabric of processes and facilities.
- Ensure that these solutions effectively contribute to total supply chain efficiency, instead of solving a problem at only one end of the chain.
- Implement simpler and cheaper controls to minimise loss.
"Reducing stock loss presents a substantial opportunity for performance improvement throughout the supply chain"
Focus Effort on Hot Products, Hot Stores and Hot Spots in the Supply Chain
Manufacturing, distribution sites and retail outlets contain a wide range of product items. Rather than investigating all the different items it is appropriate in the initial cycle of analysis to focus on ‘Hot Products’. Following the path of these few ‘risky’ products through the supply chain can help to illustrate the general features of the process and the associated problems. ‘Hot products’ is a concept that many retailers and manufacturers are intuitively familiar with, and generally refers to those products most attractive to thieves. If retailers and manufacturers were to gain a better idea of what makes a product ‘hot’, then this could, by reducing the levels of the theft element within stock loss, help dramatically to reduce levels of shrinkage within the whole supply chain.
CASE STUDY EXAMPLE 2
Analysis undertaken on the Sainsbury’s case study clearly revealed the distinctive profile of losses concentrating on particular products. Efforts were then directed onto the small number of Hot Products in order to maximise the effectiveness of the investigation.
In categories suffering relatively little theft it is also possible to isolate a small number of items that account for a disproportionately high level of loss. This is true in bakeries for instance, where some items are particularly susceptible to damage as well as cooked meats where demand for particular items is volatile and therefore cause problems with stock going out of date.
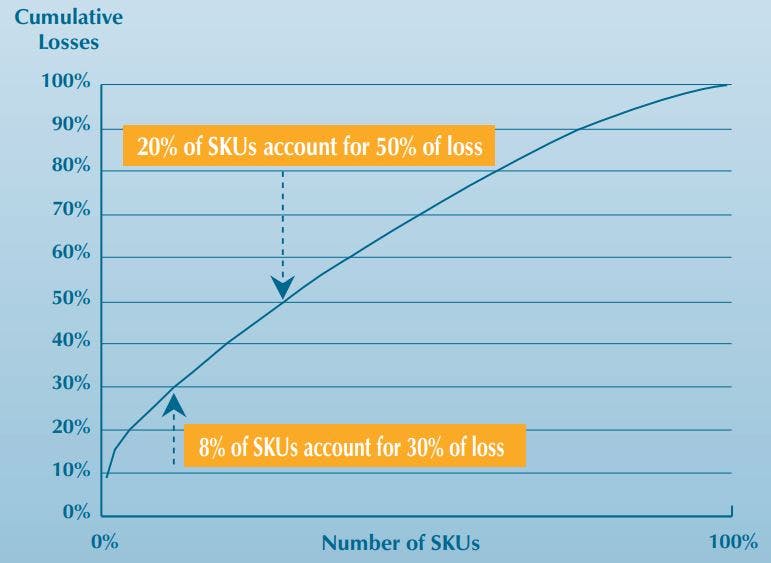
The concept of Hot Stores mirrors that of Hot Products – within a retailers’ estate the level of shrinkage is rarely evenly spread. Research commissioned by ECR has found that losses concentrate in a small number of stores that suffer a disproportionately high level of shrinkage. This phenomenon is illustrated in Figure 10, which shows the distribution of losses for a sample of European retailers.
Hot products is a concept that many retailers and manufacturers are intuitively familiar with – it is those products most vulnerable to loss
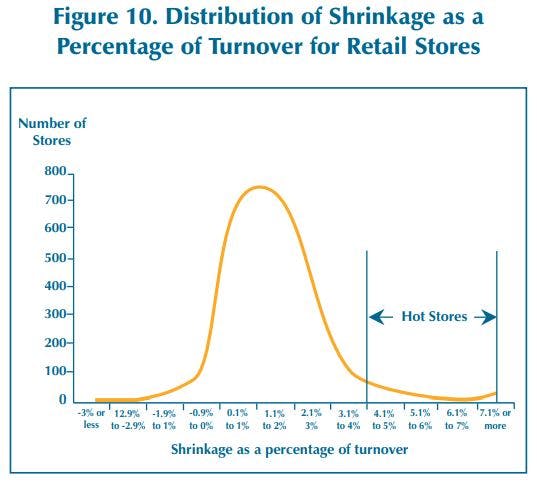
In this example, the average rate of shrinkage is 1.75%. The Hot Stores are those to the right of the graph, with shrinkage levels considerably higher than the average. The objective of any business is to not only move the average figure further to the left of the graph, but to also reduce the number of stores generating rates of shrinkage above and below the average.
The social geography of a store’s location is likely to be a significant factor that affects the level of shrinkage. However, other factors are at least as important, for example, the competence of the store manager.
‘Good stock loss results follow good managers’ John Purnell, Director of Group Loss Prevention and Security at Tesco
Applying management attention to the disproportionately high level of shrinkage in Hot Stores by bringing their processes and procedures under control is likely to deliver significant benefits. Combining this focus on Hot Stores with a focus on Hot Products can help to maximise the return from investing in a shrinkage reduction project.
Hot Spots in supply chains are the steps where process robustness is at its poorest. Not only do losses occur by accident at Hot Spots but also the lack of control allows malicious loss to occur without detection or sanction. Identification of Hot Spots is achieved by undertaking a thorough risk assessment of the supply chain, paying particular attention to where product ownership transfers between internal functions and between organisations.
Capture and Share Best Practice
Practices implemented and used to address shrinkage should be assessed to determine their effectiveness. This can take a number of forms, with the most robust being to determine the impact of a practice on the metrics described previously. Where something is found to be effective, learning points should be distilled and then disseminated across the organisation. This is particularly true when assessing pilot projects in order to transfer the learning points across a wider geographic area or to other products. In the case of a retailer, best practices can be applied across the estate and to a range of suppliers. For manufacturers this roll out could be extended to other lines in their product range and the implementation of best practice across other retail accounts in other countries.
Deploying Policy in a Structured Way
More remarkable than the amount being lost by the FMCG industry each year is the fact that this situation has been allowed to continue unchallenged for so long. Shrinkage has been a significant blight on the FMCG industry throughout modern times and little has changed in recent years.
CASE STUDY EXAMPLE 3
Whilst today’s losses are a significant drain on profits, the key issue is the failure of current approaches in stemming this loss, a point well made by Allan Cheesman at Sainsbury’s:
‘Stock loss has been a ‘cause célèbre’ for over twenty-five years.’
Allan Cheesman, Head of Beers, Wines and Spirits, J. Sainsbury’s PLC
The resilience of shrinkage to existing methods should therefore come as no surprise. The reason being the poor quality of the approach used to tackle the issue.
The ECR Shrinkage Reduction Road Map provides a structured approach to collaborating with supply chain partners on loss reduction projects. The principle advantage of the Road Map is the focus it provides. This allows significant improvements to be delivered, as demonstrated in the case studies that accompany this Blue Book.
The Road Map is capable of delivering results in compressed timeframes (often as little as a few weeks), even when deployed by teams of people who are not improvement ‘experts’. These impressive results are achieved by incorporating a series of simple, effective tools within a structured series of steps that the team can put to work quickly and easily.
The ECR Road Map provides a structured approach to collaborating with supply chain partners – it is capable of delivering results in compressed timeframes using a series of simple and effective tools
Recognise Need for Ongoing Improvement
Key to successful integration of shrinkage reduction into corporate policy is to ensure that: gains identified by the deployment of the Road Map are sustained; best practice is propagated; and further improvement sought on an ongoing basis.
Making significant inroads into the opportunity to deliver better service to shoppers and streamline operations requires time and effort. Hence improvement projects need to be undertaken on an ongoing basis. Such projects involve a combination of:
- ‘Holding the gains,’ i.e. maintaining benefits by ensuring compliance to procedures and practices designed to prevent loss.
- ‘More of the same’ i.e. disseminating best practices identified by project teams.
- ‘Innovate and adapt’ i.e. respond to new threats and opportunities.
The learning gained through undertaking ongoing improvement efforts provides an important input to policy development, and highlights the need to develop the corporate policy itself over time. For example the underlying causes of shrinkage are dynamic, which means that the metrics used to track it may need to change over time in line with prevailing threats and opportunities.
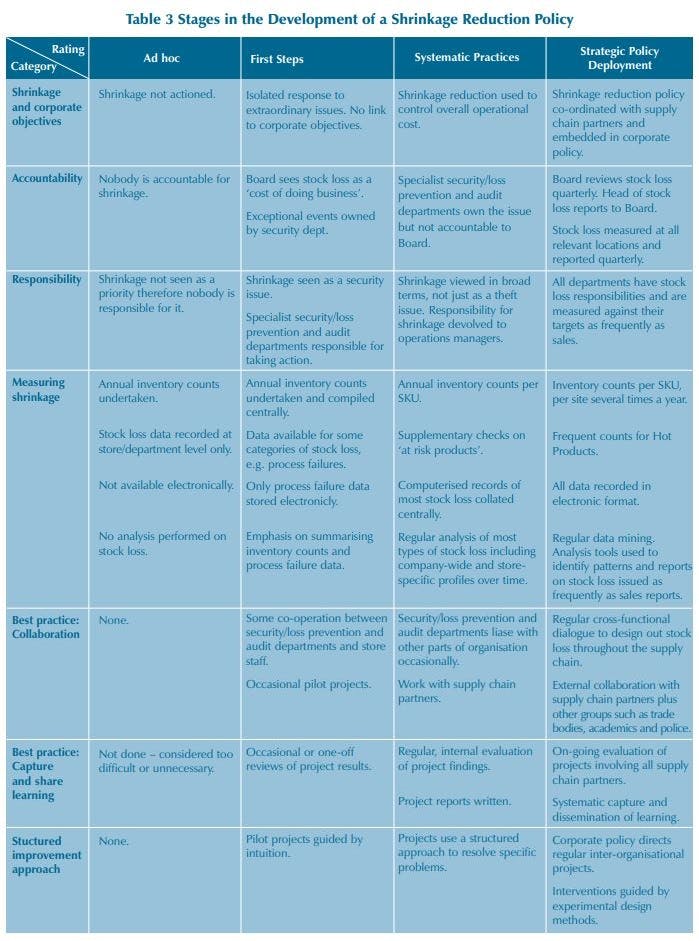
To help organisations review and develop their overall approach to stock loss reduction Table 3 provides a benchmarking tool to gauge the adoption of practices. This ‘look in the mirror’ is an important step in recognising how the overall shrinkage policy compares against best practice, as well as identifying the gaps between what is presently done and what needs to be achieved in the future.
The Shrinkage Reduction Road Map
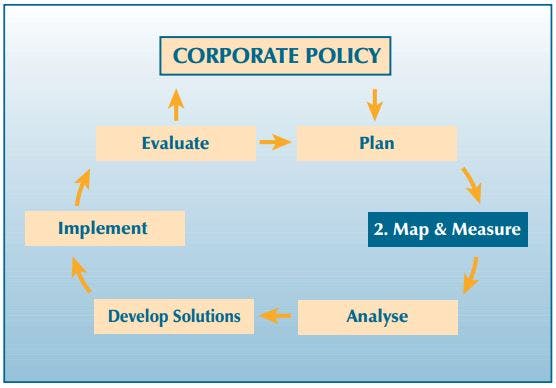
At the heart of every corporate policy lies a framework for improvement. The ECR Europe Shrinkage Reduction Road Map, ‘The Road Map’ acts like a manual, describing the overall activities that need to be undertaken in order to develop projects to reduce stock loss. It also provides an objective ‘common language’ to help communication between the various partners that come together as a team to mutually resolve shrinkage.
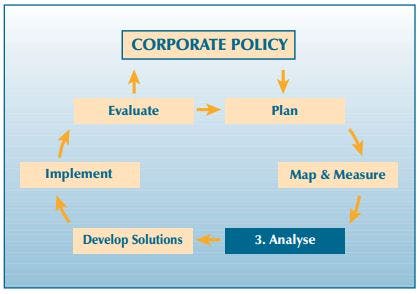
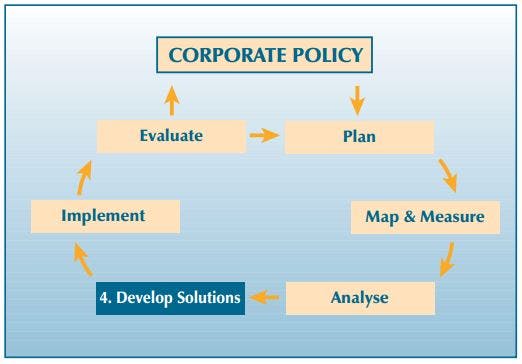
The Road Map consists of a general approach made up of the steps that need to be followed, together with techniques and tools to help undertake each phase and to deal with problems that may be encountered. The general approach that forms the heart of the guide is shown in Figure 11. This structure is systematic and provides the means for planning and undertaking stock loss reduction projects while guiding users to embrace the need for continuous improvement.
Stock loss reduction involves problem diagnosis and solution implementation. The essence of the guide is that through well-planned investigation, pressing needs are identified. These are followed by smallscale experiments that explore the stock loss problem, identify likely causes and develop appropriate solutions. Undertaking trials can then assess the effectiveness of solutions. Where a solution is found to be successful it can be incorporated in the company shrinkage policy enabling its dissemination and the standardisation of best practice.
Given the uniqueness of each business environment where stock loss occurs, a single, ‘right’ strategy for reducing stock loss does not exist. Whilst this guide provides a basic structure for practitioners, the approach needs to be tailored to match prevailing circumstances in order for it to be effective. Knowing the scope for variation, what does and does not work and the reasons why comes with learning through experience. It is important to recognise that reducing stock loss is a long-term and on-going learning process. Therefore, success comes from using the systematic approach to building the capability to identify and understand the causes of shrinkage and reinforce practices that reduce loss.
The approach described in this guide provides a means for involving all company employees in stock loss reduction. Widespread involvement provides knowledge of current practices, such as stock control, and helps build commitment that allow changes to be implemented. This involvement stretches from the analysis of the current supply chain and its performance through to process redesign, implementation and review.
To help undertake the steps of the general approach, a number of techniques and tools are provided many with supporting documentation contained in the accompanying CD. These techniques and tools have been chosen to aid communication and understanding. This list is not comprehensive and practitioners should introduce their own tools where they find them to be more useful.
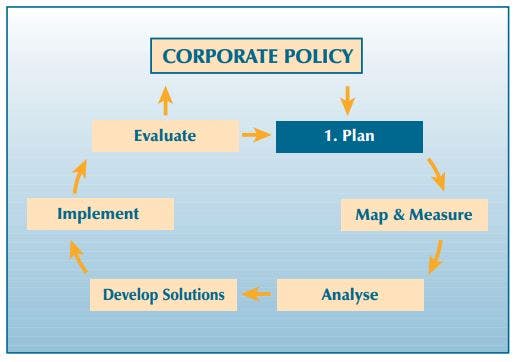
Step 1: Develop a Project Plan
Objectives
- Set a systematic approach to the project
- Identify and assemble project resources
- Undertake a stakeholder analysis
- St project goals
Set a Systematic Approach to the Project
Current efforts to contain and reduce stock loss are at best piece-meal, with few companies even operating an organisation-wide approach to resolving the problem. Companies need to recognise that traditional approaches, such as only tasking security, audit or health and safety departments with the challenge, are not effectual in tackling stock loss. Instead, companies need to change their approach to resolving stock loss and make use of a wider range of people. In changing their approach, companies need to choose one that is both systematic and holistic. A holistic approach requires involvement from stakeholders across a company and throughout the supply chain. Only through such collaboration can an effective strategy be developed for tackling shrinkage.
Identify and Assemble Project Resources
Effective stock loss reduction requires companies to be holistic by identifying, across the supply chain, where problems occur and can best be resolved. Such work requires collaboration along supply chains between suppliers, distributors and retailers as well as across the FMCG sector as a whole. Only when internal and external problems are considered together can comprehensive analysis be undertaken to deliver early, tangible results.
Undertake a Stakeholder Analysis
Having established the case for addressing the supply chain as a whole, the first step is to identify the key stakeholders in the supply chain. It is rare that any improvement project can be undertaken without an appreciation of social and cultural organisational dynamics. This is particularly true when seeking to reduce shrinkage as many of the concerns associated with it are ‘people’ issues.
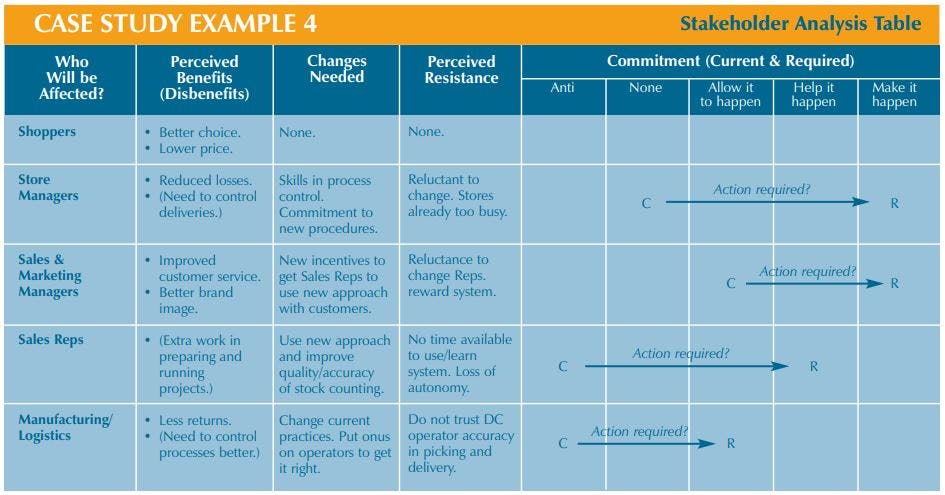
A stakeholder analysis identifies the people in an organisation and across the supply chain who will be affected by efforts to reduce shrinkage
Case Study Example 4 maps the effects that a loss reduction project will have on the stakeholders across a supply chain. The perception of the benefits and problems of these efforts are captured along with the various perceptions of the changes that will occur and the likely resistance to them. Finally, a judgement of current levels of commitment as well as those required to deliver the project is made. Efforts to resolve gaps between current and required levels of commitment must then be incorporated into the plan by the project team.
The results of the stakeholder analysis provide a valuable insight into which stakeholder groups need to be represented on the project team and where lines of communication need to be established.
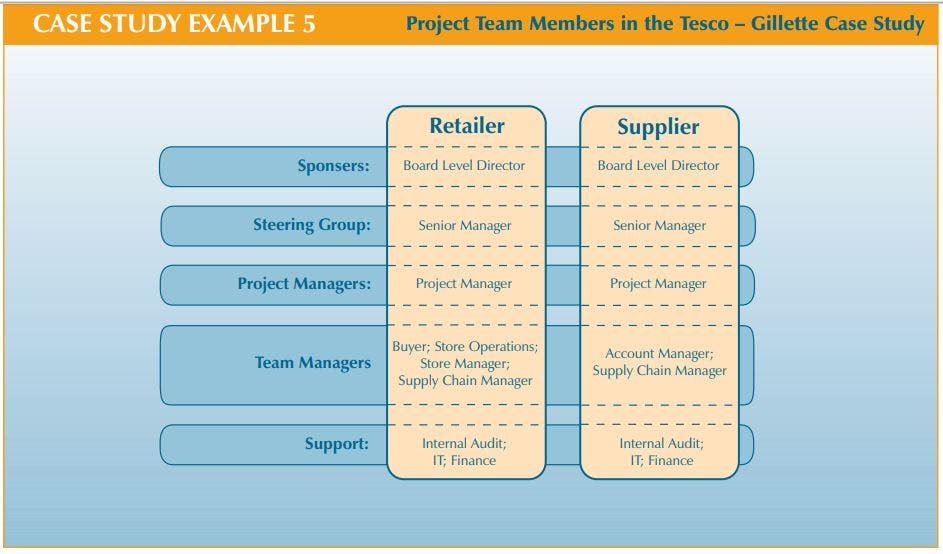
In the Tesco – Gillette case study, a stakeholder analysis helped to determine the make up of the project team. The various roles needed within the team are shown in Case Study Example 5, below.
This example shows the cascade of support from the sponsors of the project at director level, to the senior managers that lead the steering group and then to the project team itself. Whilst there are many people associated with the team, the bulk of the work falls to the project managers. These are the people tasked with delivering the project goals.
Set Project Goals
The final stage in the planning step is to set clear, realistic, attainable goals together with criteria for knowing when they are met. These goals are set by the project team who answer the following questions:
- What is the shrinkage problem?
- Where does the supply chain processes to be improved start and finish?
- What products are included in the investigation?
- What are the goals of the stock loss reduction activity?
- When is the date by which some benefits must be felt?
- What are the constraints to improvement?
The answers to these questions guide the project team’s activities towards achieving their goals. Starting the project in this way is especially important in cross-functional projects where the effectiveness and efficiency with which project resources are used dramatically improves with upfront investment in planning.
Planning for a project involves setting clear, realistic and attainable goals
Step 2: Map Key Processes & Gather Measures
Objectives
- Map key processes
- Gather measures
Reducing stock loss begins with a rigorous diagnosis of the problem. This starts by understanding the nature of the losses and then identifying their causes. Understanding the current operational system and processes is also important in gaining widespread recognition of the problem and establishing the need to change within an organisation. The act of creating a business process model that identifies the source of stock loss can develop the critical momentum required to change existing behaviour.
Security-led approaches to reducing stock loss tend to be based upon better detection of theft. A process-led approach applies process analysis to the stock loss problem and emphasises prevention. Traditional security strategies can therefore be supplemented by better understanding of supply chain processes. Process mapping and measurement provide the mechanisms to do this. Preventing system and procedural errors also removes the opportunities for theft that accompany deficient systems.
Map Key Processes
Documenting an existing process helps the project team view the various activities that make up a supply chain from a process perspective. Often, existing ways of working have never been described or even viewed as processes. Without the ability to communicate the need for improvement from this perspective, it can be difficult for some people to accept changes to the status quo.
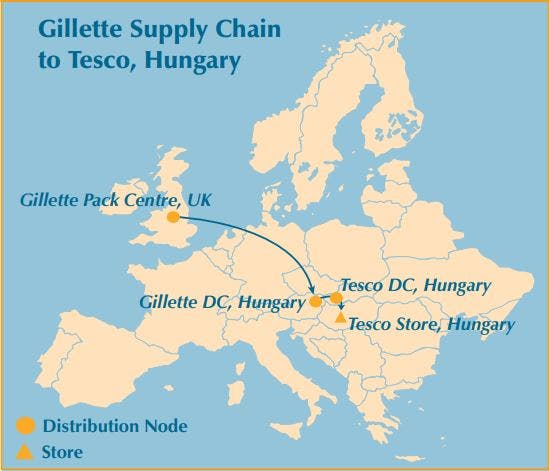
Process mapping is a technique used to: document a business process; focus on the important elements that influence behaviour; and allow the business to be viewed at a glance. Mapping and measuring a process establishes the performance base line that enables the effectiveness of solutions to be measured. An example of a top-level supply chain is depicted in Case Study Example 6. This diagram shows the supply chain from Gillette in the UK to Tesco in Hungary.
Whilst this example gives an understanding of the total supply chain, it provides few details. In order to acquire in-depth information on a process it is necessary to physically follow products as they pass along the supply chain. This involves visiting each site that the products pass through and documenting the steps involved in receiving, storing and dispatching them.
CASE STUDY EXAMPLE 6
Simple flow-charting techniques are the most appropriate way of documenting the steps of a process. When process mapping for the first time, the simplest and most effective flow-charting technique is to create a Block Flow Diagram. Figure 12 contains a block flow diagram that shows the steps involved in moving products in a retail store from backroom areas to the shelf. Where necessary, each of these process steps can be further analysed to document them to a higher level of detail.
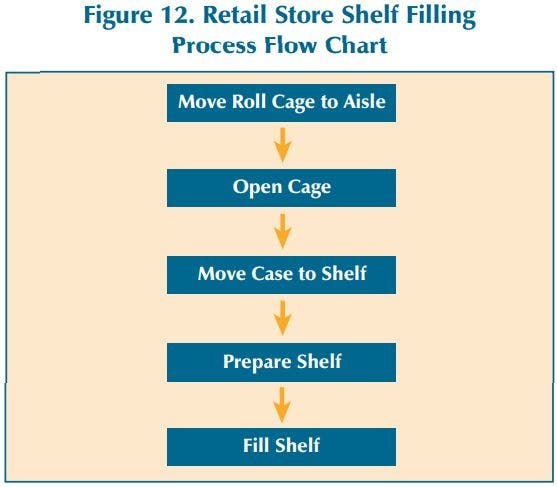
There are many different ways that a process can be represented. These alternative methods can provide useful insights, however when communicating the findings of the process mapping exercise it is wise to keep the techniques as simple as possible. Even when the flow chart does not provide a complete or totally accurate model of a process it still has considerable value where it can promote a process-orientated approach to improvements and communicate understanding.
Gather Measures
Depending upon the current information systems within the company, the project team should employ two approaches to gathering measures to understand the problem they are trying to address. The first is to identify and collate relevant existing data available within the supply chain. The second is to collect new project specific data, which may include both ‘hard’ data such as statistics on particular incidents and types of loss, and ‘soft’ data such as interviews with staff or observations collected through site visits (the CD includes example data collection instruments that can be used to help project teams carry out this task).
As discussed earlier, there are a number of measures required to appreciate the Where? What? How much? and When? of stock loss.
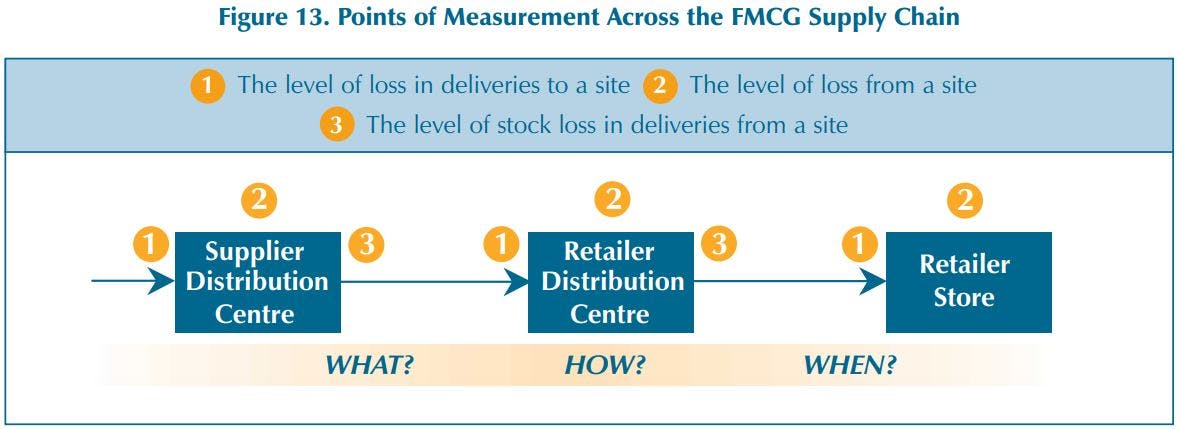
From a supply chain perspective, the following basic measures need to be collected:
- The level of loss in deliveries to a site.
- The level of loss from a site.
- The level of stock loss in deliveries from a site.
These measures allow a ‘top-level’ assessment of the extent and location of stock loss across a supply chain. In addition, it is necessary to collect data on the following factors:
- The type of incident, e.g. damage; out of date; or missing.
- How the incident occurred.
- When it happened.
This allows the nature of the type of stock losses suffered to be better understood. The points in the supply chain where these measures should be taken are shown in Figure 13. Companies need to develop an approach to data gathering that is systematic and part of an on-going process for collecting and collating timely and useful information that describes patterns, trends and information on stock loss throughout the supply chain – from first delivery to final check out.
Step 3: Analyse Risk and Identify Root Causes
Objectives
- Undertake a supply chain risk assessment
- Identify root causes of process failure
The information gathered through the mapping and measuring exercise provides an understanding of the supply chain. In order to make the best use of this information the ECR approach entails conducting a systematic risk analysis of the supply chain, identifying all the potential failures that could occur for each process step. These potential failures are documented and then each one is scored to determine its relative priority. The potential failures with the highest score are the Hot Spots in the supply chain. The Hot Spots are prioritised for further analysis, where their root causes are identified.
Undertake a Supply Chain Risk Assessment
Supply chains are made up of many individual steps where each step and the handovers between steps are points where failure can occur. At each point there are several different modes (ways) for failure to happen. Failure Mode and Effects Analysis (FMEA) is a technique that helps structure an assessment into the way a process can fail.
Each step in the process is examined and all the different potential failures associated with it are documented. A brainstorming exercise by the project team and specialists from across the supply chain is usually the most effective way of identifying all the failure modes.
A spreadsheet-based template for conducting the FMEA is provided in the accompanying CD-ROM
Having identified as many ways as possible that the process can fail, the risk associated with each failure mode is quantified. The scoring of risks considers the following criteria:
- Severity – the size of the loss, should a failure occur.
- Occurrence – how often the loss occurs.
- Detectability – how easy it is to detect loss.
Measuring the effect of a failure in terms of its ‘severity’ and ‘occurrence’ comes fairly intuitively to many people. However, the third criterion of ‘detectability’ is a little more difficult to judge but is as vital as the other two criteria to the risk assessment. The less detectable that a failure mode is, the more of a risk it presents. Undetectable failures cannot be resolved at the time they occur. Often they are detected at a much later time, if at all. The result is that the failure mode remains and the associated stock loss continues. When a thief or fraudster finds that losses are going undetected they are presented with an ideal opportunity to commit crime, which will also go undetected.
In the example below, some of the risks associated with a store delivery are assessed (Table 4).
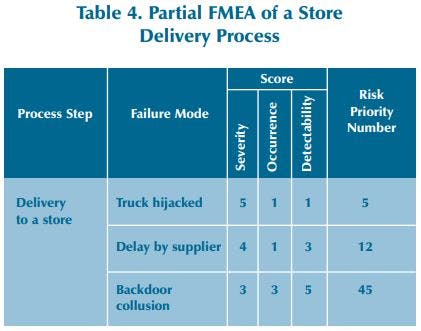
In this example, three risks associated with a delivery to a store were identified and then scored against the three risk criteria using a scale of 1 (low) to 5 (high). In this example the truck hijacking was ranked as being the most severe, however it occurred very rarely and was considered as being very detectable. Multiplying the scores together gave this failure mode a relatively low risk priority number. In contrast, backdoor collusion at the store where goods are signed for but not delivered was thought to be moderately severe but occurred fairly often. This problem was also very hard to detect so this failure mode ended up with a relatively high risk priority number.
The highest scores calculated during the risk assessment for the supply chain as a whole reveal the ‘Hot Spots’. These Hot Spots are the points in the supply chain that present the greatest risk of loss. They are therefore prioritised for further investigation to determine their root causes. This is undertaken using the two tools of cause and effect analysis and 5-why analysis, described below. The cause and effect and 5-why analysis are repeated for as many Hot Spots that the project team has the time to investigate.
Identify Root Causes of Process Failure
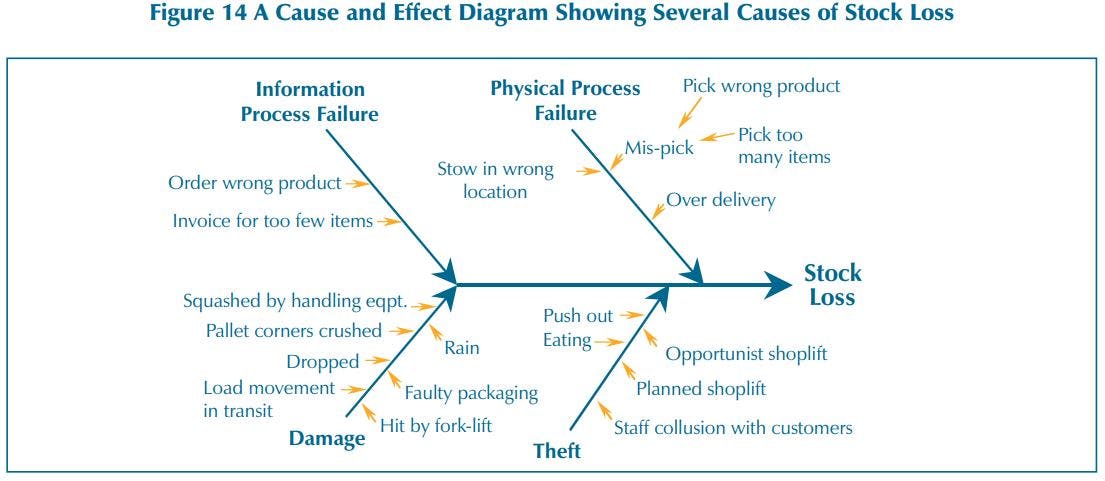
A range of individual problems, as well as interactions between problems can cause supply chain Hot Spots. In order to reduce losses, a cause and effect analysis is undertaken on each Hot Spot. In keeping with the ECR principle of collaboration, the cause and effect analysis is once again a team effort. A further brainstorming session allows everyone to contribute their findings, experience and understanding. The key to the analysis is for the project team to repeatedly ask themselves variations around the question; ‘How/why/when does process or procedural failure occur at this Hot Spot?’ An example of the results from a cause and effect analysis is shown in Figure 14.
When the brainstorming is over, it is common for a team to identify a considerable number of ideas on what causes a Hot Spot. To focus effort, the key causes of failures need to be identified from amongst the trivial many. This could be achieved statistically through the collection of data from a process using check sheets to determine the number of incidents associated with each of the causes that have been suggested. However, it is possible to get the project group members to identify many of the most significant problems from their experience. The review by the team members should aim to identify between three and seven key issues from amongst the individual ideas. These issues should capture the essence of what is causing the Hot Spot.
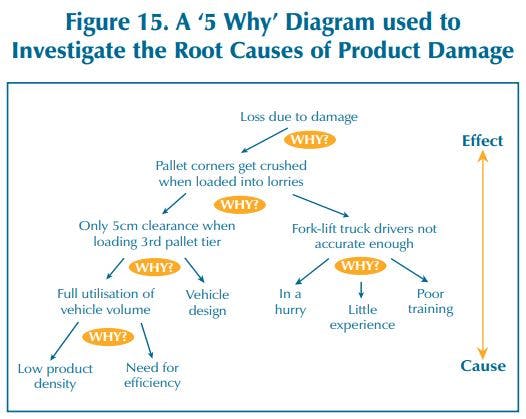
Often, the themes that are identified are themselves symptoms of other, more fundamental problems. It is therefore necessary to investigate further and identify the ‘root causes’ of the problem. In order to do this, the ‘5-why’ analysis tool is used.
5 Why Analysis
Initial ideas about the causes of problems are unlikely to identify underlying root causes. Having filtered the initial ideas and focused upon the significant ones, deeper cause and effect structures need to be identified. A technique to explore causes beyond those first perceived is ‘5 why’ analysis. This involves understanding the cause and effect relationship as fully as possible by repeating the question, ‘Why?’ This technique is illustrated in Figure 15 where the root causes of loss due to damage are investigated.
Using Risk Assessment to Address Theft
Risk reduction using FMEA and cause and effect analysis is a common approach to ensuring manufacturing processes conform to specification and is a significant help in reducing shrinkage caused by process failure, as described above. It is also well placed to help structure efforts to reduce shrinkage caused by theft as the following example aims to demonstrate.
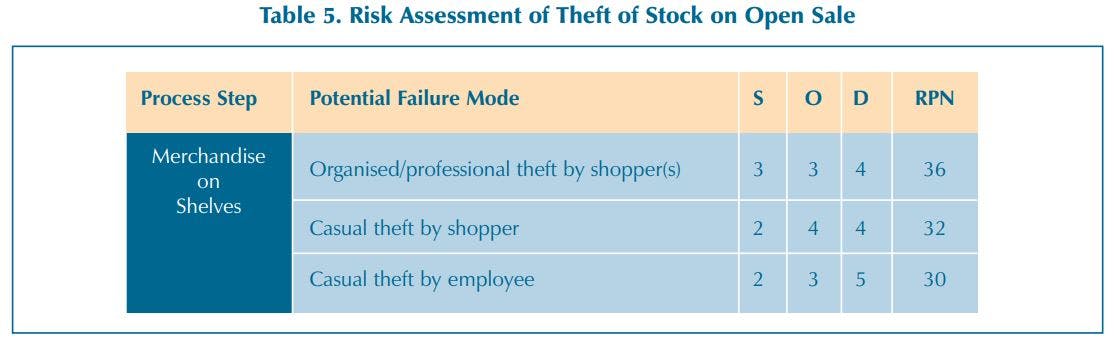
A risk assessment was undertaken for a retail store, focussing on the risk of theft of a Hot Product line that was merchandised on open sale. The results are shown in Table 5 below
The problem of stock loss is dynamic – companies need to continually analyse the threat
All three of the potential failure modes were found to have a relatively high risk priority number, justifying further investigation into the root causes of these risks. A brainstorming exercise was conducted with people from store operations and the Loss Prevention team who contributed their ideas on the causes of off-shelf theft. The results of this exercise were filtered, identifying three key issues concerning product attributes, the location of the product in the store and the quantity of stock held on the shelves. Each issue was further analysed using the 5-why technique to uncover the root cause of the problem.
The result of this exercise was to highlight several root causes that were increasing the risk of theft from the shelf. Having diagnosed the problem and identified the root causes it is now possible to seek appropriate solutions to reduce risk.
End Note
Identification and understanding of root causes concludes the diagnosis of the causes of stock loss and starts the ‘remedial journey’, where solutions to these problems are sought. It is important to stress however, that the problem of stock loss is dynamic, particularly when considering the threat from internal and external thieves. Companies need to continually analyse the threat in order to react promptly to new approaches adopted by offenders.
Step 4: Develop Solutions and Prioritise Actions
Objectives
- Design solutions that reduce risk
- Balance solution cost against projected benefits
Organisations traditionally start their stock loss reduction efforts at this, the solution stage. It is not uncommon to find a great solution and then search for a problem to apply it to, particularly given the large number of seductive solutions currently available. However, this is totally at odds to the systematic approach advocated here. Having been through the diagnostic investigation described in the Road Map, where a stock loss problem has been investigated and its causes identified, it is usually clear that the solutions that resolve these causes and hence reduce loss are extremely context-specific.
Bearing in mind that the effectiveness of specific solutions is extremely context-specific, it is not possible in this book to associate particular solutions with particular problems. However, a series of options are presented in the CD that accompanies this book. The 68 solutions listed have been grouped into four different types: procedures and routines; design and layout; equipment and technology; and people and processes. It is not an exhaustive list of possible stock loss reduction options and many other possible solutions are currently available. The solutions are listed in alphabetical order and no attempt has been made to ‘rate’ their effectiveness.
Designing Solutions that Reduce Risk
The supply chain risk assessment described earlier helps the project team to identify specific actions to reduce the risks they have identified. This is possible because during the risk assessment, the failure modes were assessed against the three criteria of Severity, Occurrence and Detectability. High scores against one or all of these criteria point the team to where actions need to be taken. These actions are usually context specific, for example, in the Gillette/Tesco case study, there was a supply chain Hot Spot where product could be lost when stored in the back of a store. Risks relating to detectability and severity of this failure mode were both assessed as being high. This pointed the project team to take action to improve the detectability of loss by introducing a daily stock count. The action taken to reduce the severity of loss was to minimise the amount of stock held in the back of the store and increase detectability through regular checks (See Case Study Example 7).
CASE STUDY EXAMPLE 7
The 10 steps are generic solutions developed by the Gillette Company in collaboration with its customers. In essence, it is a series of solutions designed to enable a retailer to more effectively increase product availability and at the same time reduce stock loss in their stores.
The core 10 steps are:
- Secure delivery: Separate out high risk products and deliver them in sealed pallets.
- In-store champion: Identify a member of staff to take responsibility for checking product movements.
- Fast tracking to secure area: The delivery area leaves products vulnerable – move them to a secure area as soon as they arrive.
- Check deliveries: Checking deliveries is important – mistakes show up as stock loss.
- Visible locations: Keep products on open sale but in highly visible locations.
- Anti-theft fixtures: Use fixtures that slow down the rate at which products can be removed.
- Appropriate replenishment: Stock shelves to match rate of sale – too much product tempts thieves, too little frustrates shoppers.
- Regular counting: Count high risk products regularly to track losses and allow accurate reordering.
- Staff awareness: Encourage all staff to be more vigilant.
- Measure and adjust: Measure the effectiveness of solutions, review and adjust the process accordingly.
Balancing Solution Cost Against Projected Benefits
Good solutions strike a balance between the benefits they deliver in reducing loss and the cost of achieving these benefits. In order to estimate this balance it is necessary to quantify the costs, both in terms of capital costs (such as buying equipment and training staff) and recurrent costs (such as maintenance or extra staff time).
The project team then need to calculate the benefits brought about through the introduction of the solution. For most projects this will be measured by the amount shrinkage is reduced and possibly increased sales. These benefits are likely to be recurring but may diminish over time depending upon the nature of the intervention. The project team needs to estimate what the likelihood is that the expected benefits will be sustained and over what time period.
COST BENEFIT EXAMPLE
Having investigated a supply chain, a project team identified a particular solution that removes one of the root causes of shrinkage for a Hot Spot. This solution has the potential to reduce shrinkage each year by €40,000. It is thought that 75% of this potential reduction can be realistically achieved in the first year. The team expects the effectiveness of the solution to decrease by 10% in subsequent years. The initial cost to implement the solution will be €20,000 and it costs €15,000 each year to keep operating the solution.
Year 1: Expected Benefit – Cost of Implementation = Net Contribution
(€40,000 x 0.75) – €35,000 = -€5,000
Year 2: Expected Benefit – Running Costs = Net Contribution
(€40,000 x 0.75) x 0.9 – €15,000 = €12,000
The overall net benefit is that the solution has both paid for its implementation and saved the company €7,000 within the first two years.
Step 5: Implement and Trial Solutions
Objectives:
- Develop implementation plans
- Implement solutions
In a similar manner to the approach used to plan the project investigation, the implementation of the solution that will reduce stock loss requires project planning. Successful projects require a sponsor to be responsible for delivering the benefits of the project. To achieve success the sponsor, usually a senior manager, needs to ensure that the project team constructs a clear and robust business case. This defines what is to be delivered, the benefits it will bring and the resources required.
The scale and scope of the solutions to be implemented varies considerably between projects however they tend to be variations around four main archetypes:
- Simple, quick and effective fixes
- Application of established best practice
- Experiments
- Business case pilots
Simple, quick and effective fixes (known in America as ‘no brainers’) are solutions that make good sense to be implemented straight away. Examples of these include ideas that the organisation thought it was already undertaking (such as re-establishing procedures that have lapsed); widespread application of ideas that are already tried and tested (such as regular counting); and low cost/no cost ideas that tighten up procedural adherence (such as refund policies).
The application of established best practice takes good ideas that are known to reduce risk and deliver profit improvement. Examples of this include controlling at-risk products the same way as established Hot Products such as cigarettes, cash and high value alcohol.
Experiments involve implementing seemingly good ideas that lack information on their effectiveness or potential impact on other aspects of the business.
The outcome in these implementations may not necessarily be to reduce shrinkage but to learn more about the solution itself. This may be thought of as a ‘shake down test’ of a piece of equipment or a particular process and above all as a learning opportunity.
Business case pilots trial ideas that are conceptually robust but where the data on which to make a cost/benefit analysis is lacking. The purpose of this work is therefore to assess benefits and costs of implementing the solution in an operational setting.
Develop Implementation Plans
No matter what type of solution has been selected, an implementation plan helps ensure the desired objectives are delivered within time and cost limitations. Here the tools of project management will prove useful. These can be applied on both small and large-scale projects. Where a project team undertakes planned change for the first time, the plan should consider not just the task but also the learning necessary to deliver it.
At a top level, an implementation plan is constructed by following a sequence of steps. The following provides an overview of such a process:
- Construct a communication plan to ensure stakeholders are consulted with and kept informed.
- Identify the overview tasks needed to complete the project.
- Show the interrelationships between tasks and the sequence in which they can be undertaken.
- Estimate the types and amount of effort needed to complete these tasks.
- Calculate the resource profile over time to complete the implementation.
- Identify potential risks to successful implementation delivery.
- Mitigate risks or plan contingency.
- Iterate the plan to match it against resource availability.
- Secure resource.
- Put in place procedures for evaluation.
Evaluating the effectiveness of the stock loss reduction effort provides information that guides the direction of the next cycle of reduction. Stock loss reduction needs to be ongoing to ensure loss reduction efforts are compatible with developments across the supply chain and to counter the resourcefulness of criminals.
Performance Measures
At the planning stage of the project, the metrics to be used to evaluate the performance of an intervention need to be clearly identified. For most projects these will be relatively straightforward, such as the level of loss, levels of on-shelf availability or levels of sales.
However, other outcomes may need to be identified, such as:
- Actual cost against planned cost.
- Actual cost/benefit against planned cost/benefit.
- Levels of loss on similar products not included in the experiment.
- Levels of loss on unrelated products.
- Impact on working practices of store staff.
- Development of staff skills.
- Better relationship with supplier/retailer/other departments in the company.
- Extent to which staff awareness is raised.
Stock loss reduction needs to be ongoing to ensure loss reduction efforts are compatible with developments across the supply chain and to counter the resourcefulness of criminals
In order to subsequently determine the effect of implementing changes it is necessary to establish a performance base line. This requires the necessary measures to be gathered before any changes are made (see earlier).
Experimental Test Design
Many projects include trying out a particular intervention on a number of test stores to see what impact it might have. The principle is relatively simple, but there are a number of basics guidelines to follow if such an approach is to be adopted. A key part of this is measuring the performance of the intervention in a number of selected stores and comparing this against another group of stores, often referred to as a control group, which do not have the intervention introduced.
There are usually three stages to this approach: a period of time before intervention when data is gathered from the site of the intervention and a control location (pre-measure phase); a period of time when the intervention is introduced into the experimental site only (intervention phase); and finally measures are taken over a period of time, post implementation (post-measure phase).
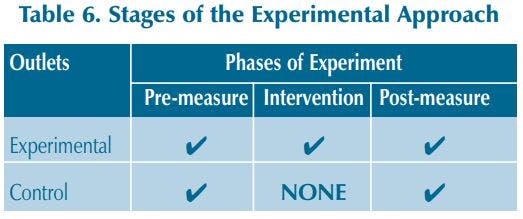
Assuming that conditions in the experimental and control stores have stayed more or less the same (this is something you will need to monitor throughout the process), then the difference in the scores before and after the intervention can be compared and any significant differences associated to the introduction of the intervention.
Points to note:
- It is important to make sure that the experimental and control stores are of a similar type (similar size, types of product etc).
- It is recommended that there is at least 5 stores in each group otherwise the subsequent data may lack validity.
- The period of time to measure before and after the intervention should be a minimum of three months and where possible, longer.
- Because of the seasonality of the FMCG sector, where possible comparable data from the previous year should be used.
- Do not start the post measurement phase until all the experimental stores have had the intervention introduced, tested and where appropriate, staff trained to use it.
One possible problem with carrying out experiments is the ‘Hawthorne Effect’. This is where changes in the KPIs occur not because of the intervention itself but simply because an experiment was being carried out. For instance the presence of project staff in the experimental stores or the requirement of store staff to collect new data, may have an impact on the KPIs – store staff may become generally more vigilant because they know they are part of an experiment.
Therefore, it is important to consider continuing to measure the performance of the intervention after the official experimental period is over. In addition, the performance of an initiative can change as its ‘environment’ alters. For instance criminals may gradually find ways of defeating the newly adopted approach or changes in product range or levels of staffing might reduce its effectiveness. Therefore, periodic reviews of newly adopted measures may need to be carried out in order to gauge their effectiveness over time and to evaluate whether any corrective measures need to be taken.
Above all, it is vital to recognise that the learning from undertaking the project and the conclusions drawn are very valuable. At a strategic level, these lessons provide a key input to informing the ongoing development of corporate policy. At the operational level, the findings can direct the project team to new opportunities for improvement. Both will have further impacts on the competitiveness of the organisation and support its ongoing drive to improve shopper satisfaction.
It is vital to recognise that the learning from undertaking a project and the conclusions drawn are invaluable in developing a strategic corporate shrinkage plan
Implement Solutions
The actual pilot project itself involves installing the solutions that were developed in response to the opportunities for loss reduction that were identified in the risk assessment. Gaining the support of the people involved in the operation and who will have to make use of the solution is important. They should therefore be consulted on and involved in any changes to their activities. Where necessary, training must be provided not only at the start of the project, but also over time due to staff turnover and complacency
Step 6: Evaluate Implementation
Objectives
- Determine impact of intervention
- Integrate best practice
Each stock loss reduction project must end with a rigorous evaluation of the impact the intervention has had and a decision about how any successful solution might be used.
Determine Impact of Intervention
An evaluation of the intervention must be objective. All too often reviews are undertaken with the aim of justifying the work that has been done and fail to provide an honest appraisal of what solution worked and why. Therefore, the evaluation should be rigorous, robust and led by somebody who can provide an objective review, independent of equipment providers and those who may have commissioned the project in the first instance. They need a clear mandate to assess the performance of the implemented solution and compare this against the level of performance originally planned.
The impact of the intervention will be judged against the appropriate objectives. As discussed previously, different criteria should be used depending on the information being sought. For example, an ‘experiment’ may seek to prove that a concept can operate in a real world setting but not necessarily affect shrinkage at this stage in its development. Conversely, a business case pilot seeks to gather the information required to undertake a cost/benefit analysis of an intervention. That is to determine the savings from reduced shrinkage and identify the cost of effort and resource required to deliver these savings.
An evaluation of the intervention must be objective – it should be rigorous, robust and led by somebody who can provide an objective review
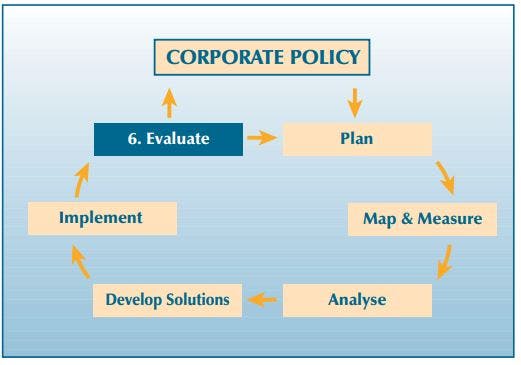
In addition to specific, quantitative results the evaluation of each project presents the opportunity to capture a range of learning (Table 7).
Much of this learning will be transferable to other situations and subsequent projects and therefore a project evaluation is a significant source of knowledge.
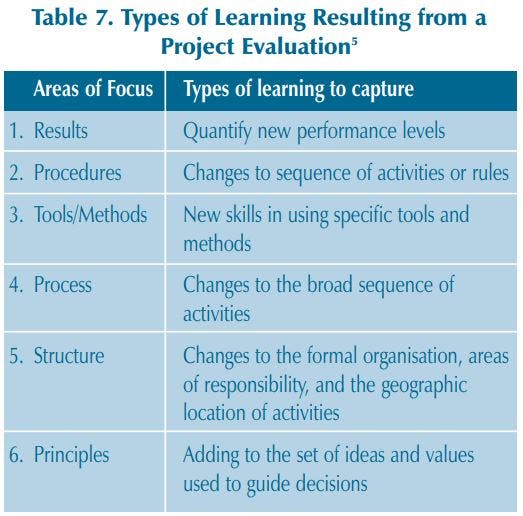
Integrate Best Practice
Assuming the intervention has been successful and the KPIs show a real impact, the next step is to decide what to do with the information. A number of options are possible in terms of the products and places where the intervention might be used. The type of roll out is highly dependent upon the type of intervention chosen, but a number of scenarios are possible. Some of the common types of roll out are listed in Table 8.
These options are not mutually exclusive (it may be possible for instance to use in similar stores but with all products in the same category), but it is vitally important to monitor the performance of the intervention when moving away from the places and products used in the experiment.
Table 8. Types of Roll Out
Places
- Roll out to all stores
- Roll out to similar stores
- Roll out to specific stores with high levels of loss (Hot Stores)
Products
- Use on all products
- Use on the same products only
- Use on other products in the same category
- Use on other products in a similar category
Road Map Epilogue
The overall aim of the Road Map is to help companies develop and deliver a corporate policy that enables organisations to reduce the impact of shrinkage, increase shopper satisfaction and improve the overall profitability of the company. It does this through utilising an approach that is holistic, systematic and based upon genuine collaboration between all partners in the supply chain. The Road Map has been tried and tested to determine whether it can benefit those companies who use it. The case studies accompanying this book graphically demonstrate this to be the case.
Since its development, the Road Map has been used by a wide range of companies around the world, and the ECR Shrinkage Working Group has been delighted to receive reports from organisations that responded to the shrinkage challenge and independently followed the advice offered in the first edition of the Shrinkage Blue Book. These projects further demonstrate that the Road Map is a robust tool that can be tailored to meet the challenges of shrinkage in markedly different social and economic circumstances. The ECR Shrinkage Working Group welcomes the opportunity to hear other experiences of the way the Road Map has been used and to share our learning with the users of it. With this thought in mind, the final piece of advice from the ECR team is: embrace the challenge, make use of the Road Map and deliver the benefits that surround you. Above all, the time to start is now: • Carpe Diem • Seize the day • ‘Just Do It’.
Shrinkage Reduction Case Studies
The first phase of work by the ECR Europe Shrinkage Working Group shed light on the scale of shrinkage in Europe, confirming that it is a major issue for the FMCG industry. In addition, a collaborative approach to reducing shrinkage and releasing benefits for shoppers and businesses alike was devised. The ECR Advisory Board recognised the opportunity for improvement the approach presented. Accordingly the Advisory Board commissioned the Shrinkage Working Group to launch a series of pilot projects to determine whether this faith could be justified.
A number of companies proposed projects to the Shrinkage Working Group, who selected four of them. The pilot projects were selected to ensure pilots were drawn from a range of countries, companies, product categories and retail sectors. An additional, fifth case was undertaken with Sainsbury’s and a consortium of branded spirits suppliers, who funded a project between them. The five case studies are summarised below in Table 9.
The Working Group acted as an advisory board to the projects. They ensured that the projects were treated in an objective manner in order to assess the efficacy of the collaborative approach to shrinkage reduction whilst meeting the aim of the companies, i.e. to resolve specific problems.
The remit of the support provided to project teams through ECR Europe was to ensure a consistent application of the approach developed by the ECR Shrinkage Working Group, as described in this book. For example, where members of the project team executed their obligation to secure maximum benefits for their company then the independent team member from ECR acted to highlight where collaborative behaviour was being subverted. The other principle task of the ECR support was to quantify the effects of the application of the approach on business performance.
A review of each of the five case studies is provided below. In addition, each case study is complemented by a presentation, which can be found on the CD. These presentations were compiled and delivered by the project teams and delivered at ECR congresses. They consist of a PowerPoint presentation with both slides and accompanying notes. Two of the case studies have supporting videos, which are also on the CD.
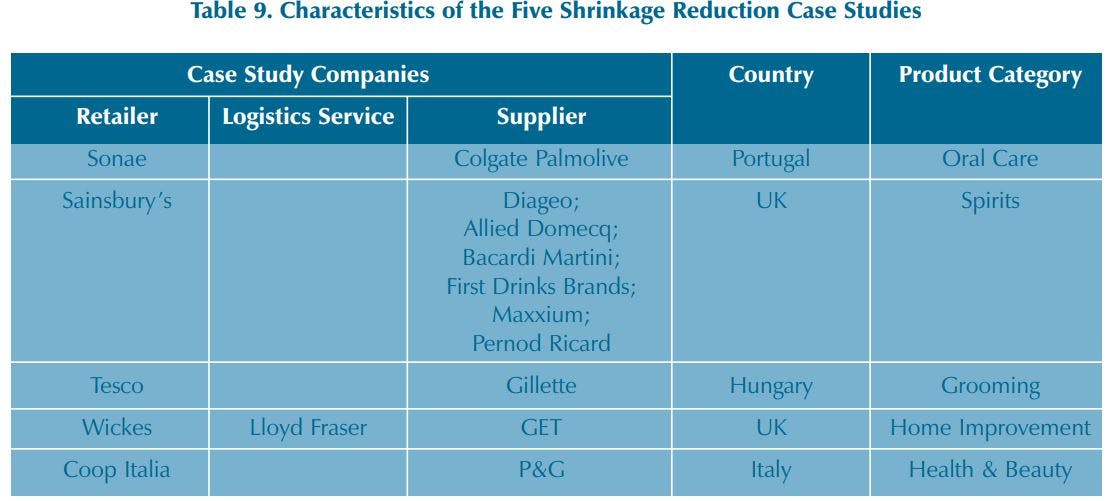
Sonae and Colgate Palmolive
Portugal
Lessons for the ECR Community
The Sonae/Colgate Palmolive shrinkage reduction project delivered a 29% reduction in shrinkage in the six stores where the pilot project was undertaken. In addition to providing strong evidence to support the claim that, ‘The ECR Road Map works,’ there are several lessons that should be useful to the wider ECR community:
The root causes of shrinkage were identified as being failures in supply chain processes and operational procedures. By following the Road Map the project team revealed where major opportunities for shrinkage lay. The team called these the ‘Hot Spots’ in the supply chain.
The solutions developed and implemented by the project team targeted the Hot Spots. The reductions in shrinkage were achieved by reducing the risk of process failure and removing the opportunity for losses to go undetected at the Hot Spots.
By approaching shrinkage in a systematic manner, the project team delivered reliable and robust findings in a shorter time period than if they had approached their work in an ad-hoc manner.
The knowledge gained from this project is being leveraged by Sonae through applying it to other suppliers’ products and by Colgate Palmolive through applying it to other retail chains.
Introduction: Shrinkage Threatens Actibrush Success
Colgate Palmolive stole a march on their competitors in the oral-care category with the introduction of Actibrush in year 2000. This battery-powered toothbrush provides consumers with many of the benefits of regular electric toothbrushes but at a substantially lower price, opening up a market niche in which Colgate had ‘first mover’ advantage. In a competitive category, Colgate sought to consolidate their position with a succession of product and promotional enhancements, such as the introduction of coloured and themed variants to complement the original, white model. A significant addition to the product range was the introduction of ‘Bzzz’, a children’s version. The success of this model was helped in no small part by an agreement to use the characters from Harry Potter. However, unbeknown to Colgate Palmolive, the same characteristics that made Actibrush a commercial success were also making it a ‘Hot Product’.
Close Commercial Relationship
Strained by Profit Slump
The relationship between Sonae and Colgate Palmolive is symbiotic. As Portugal’s leading grocery retailer, Sonae is a key account for Colgate Palmolive. Conversely, Colgate Palmolive products are a major sales generator for Sonae, with the Colgate range especially significant in the oral-care category. When the profitability of retailing Actibrush was hit by a notable rise in shrinkage, this became a key concern for Sonae’s buying team.
Veiled Threats Highlight Need for Action
Rather than suffer alone, Sonae took the natural step of drawing the shrinkage problem to the attention of Colgate Palmolive’s sales team. To underline their concerns, Sonae made it clear that losses must be quickly brought under control otherwise draconian actions would be imposed. Possible actions under consideration, to prevent further margin erosion, included defensive merchandising, e.g. taking Actibrush off open sale, and/or seeking ‘compensation’ from Colgate Palmolive for a proportion of the value of the losses. Thus the scene was set. The need to reduce the level of shrinkage was clear and there was motivation at both Sonae and Colgate Palmolive to quickly resolve the issue. Failure to respond to the situation was not an option at a personal level, bonuses were at stake, and neither company could benefit from soured relations.
ECR Road Map Shows the Way Forward
Enthusiasm the Order of the Day
The circumstances faced by Sonae and Colgate Palmolive are similar to those faced by many buying and sales teams across Europe, where shrinkage spirals out of control and an obvious solution is not available. This is exactly the situation that proves to be a fertile ground for successful application of the ECR shrinkage reduction Road Map. The Road Map brought to the Sonae/Colgate Palmolive project team a structured approach to solving the problem they faced, into which they could invest their enthusiasm and industry knowledge. As the team followed the steps of the Road Map, the effectiveness of their actions increased by using the tools and techniques that accompany the Road Map.
Personal Commitment Required
In addition to bringing shrinkage under control, the Sonae/Colgate Palmolive team aimed to be true to the ECR principle of collaboration whilst also delivering the necessary results rapidly. Delivering these three objectives became the responsibility of the category buyer at Sonae, Patrícia and two key account managers at Colgate Palmolive, Diogo and João. This core team was supported by specialists, for example from logistics and store operations, as well as Cranfield School of Management who provided guidance on applying the Road Map approach. The ability of the project team to deliver their objectives was enhanced by the clear support of senior management at both Sonae and Colgate Palmolive. These managers gave support and guidance to their own people as well as meeting together on an occasional basis to help progress the project. This personal commitment to delivering the objectives from a variety of management levels maintained the impetus behind the project and appeared instrumental in delivering thorough results in a condensed time-frame.
Collaboration Delivers Rapid Results
As the team themselves said, ‘Speed was our buzz word.’ In just nine days of hands-on effort, spread over a period of nine weeks, the team systematically followed the Road Map. In their investigation of the Distribution Centres for both Colgate Palmolive and Sonae and a selection of Sonae stores, the team mapped the supply chain and gathered the performance data necessary to undertake a thorough analysis of the supply chain.
Using Failure Mode and Effects Analysis, FMEA, three ‘Hot Spots’ in the supply chain were discovered where control of products and clarity of information was poor. These Hot Spots were major points of risk where the supply chain operation lacked adequate control, risked failing and provided the opportunity for organised theft and pilferage. The three Hot Spots occurred in the following steps of the supply chain:
- Picking and dispatch operation at the Sonae DC.
- Receiving and warehousing operation at the Sonae stores.
- The shelf in the stores.
Having demonstrated where the major risk of stock loss existed, the team worked to develop solutions that resolved these problems. Decisions made at this step in the Road Map can have significant commercial implications, which can cause tensions to arise in the project team. This is where adhering to the ECR principle of collaboration pays the greatest dividend. Team members should strive to get the best deal for their own company and recognise that in the long term those solutions that deliver win-win returns will be the ones that survive in the long term.
Focus on Severity, Occurrence and Detectability to Reduce Risk
The key to the successful reduction in shrinkage was to be pragmatic and seek solutions that (i) reduced the severity of losses, (ii) reduced the number of times that losses occurred and (iii) increased the ability of a loss to be detected at the time it happened. Applying these principles, the Sonae/Colgate Palmolive team developed a series of solutions that improved logistics flow and procedures. These were adopted across the supply chain: at Colgate Palmolive’s DC; at Sonae’s DC; and in the stores themselves. In order to respond to the threat of theft from the shelves of the stores, a number of security measures were implemented.
In the supply chain, the solutions included isolating Hot Products such as Actibrush from other products and rigorously controlling their storage and movement. For example, the movement between Sonae’s DC and stores was undertaken in a Hot Box. Although only cardboard, the box was clearly identified and it’s contents listed. The Hot Box was loaded onto the delivery truck last and its contents verified beforehand. Upon receipt at the store, the Hot Box was unloaded first and it’s contents linechecked and verified. Discrepancies were therefore immediately alerted. From delivery, the contents of the Hot Box were immediately merchandised onto the shelves, avoiding any delay in the vulnerable back-of-store area. Should there be excess stock, this was stored in a secure location under lock and key with a single person accountable for the inventory. On the shop-floor, the amount of inventory of Hot Products is kept to a minimum, with daily store replenishment removing the need for large quantities to be held. An inventory count is undertaken at least daily so theft can be immediately discovered. When this is discovered, CCTV footage of the area is reviewed to identify possible suspects. The identity of these people is tracked over time and action taken to prevent reoccurrence through raised shop-floor staff and security personnel awareness.
Holistic Supply-Chain Response Delivers Results
Having viewed shrinkage as something more than just shoplifting from stores, the Sonae/Colgate Palmolive team were able to deliver a holistic response to the problem they faced. The effectiveness of their approach and the solutions they implemented is evaluated by considering the effect this had on shrinkage. A trial of the solutions developed by the Sonae/Colgate Palmolive team was undertaken in the two companies’ DCs and in six stores, which resulted in a 29% reduction in shrinkage.
The effectiveness of the solutions in reducing shrinkage has led to Sonae deciding to roll-out the in-store solutions to all their stores. This programme is not restricted to Colgate Palmolive products such as Actibrush. Sonae believe the benefits of their work with Colgate Palmolive will apply to Hot Products in general. They are therefore beginning to roll out the ECR Road Map approach and the solutions they have already developed to include other suppliers, not just in the oral-care category. In a similar vein, Colgate Palmolive is applying the knowledge gained from following the ECR Road Map to collaborate with other key customers.
Sainsbury’s and a Consortium of Branded Spirits Suppliers
United Kingdom
Lessons for the ECR Community
The objective of this project was to understand the nature of the threat posed to branded spirits in the Sainsbury’s supply chain and propose actions for Sainsbury’s and the brand owners to reduce stock loss. To the satisfaction of all parties, a number of insights were identified and a few myths dispelled. These should prove interesting reading for the ECR community at large.
The spirits supply chain provides great insights into the nature of stock loss. Firstly, the bonded supply chain was found to be virtually ‘water tight’ – almost nothing is lost from it. Conversely whilst branded spirits are a major driver of retail sales, the losses experienced by Sainsbury’s in this category were significant. This research summarised the reasons why the bonded system works so well, from a loss prevention perspective, and applied these lessons to the retail outlets. Put simply, successful loss prevention in the spirits supply chain is not an accident. It results from a person accountable for stock loss using information on loss incidents to prevent further occurrences.
Applying this lesson to retail stores reveals the need to assign accountability for stock loss to a member of staff. Information is needed to determine which products are the Hot Products and where the Hot Spots in the supply chain lie. Action can then be applied to these products and places to prevent further occurrence of loss.
Introduction: A Rude Awakening
Sainsbury’s are paving the way for the rejuvenation of their fortunes through a significant investment programme. In addition to an impressive new headquarters and spending a reported €800 million (£500 million) on its distribution network, the company has outsourced a significant element of its ICT capability to Accenture, a management consultancy. This arrangement led to a major upgrading in Sainsbury’s management information systems. With its new ICT systems in place, Sainsbury’s now has the capability to capture detailed data on operational performance. With what appears to be industry best practice, stock loss data can be collated on a weekly basis, by store, by stock keeping unit (SKU/reference).
Whilst the data gathering capability of Sainsbury’s systems is impressive, the information it compiled came as a rude shock to Allan Cheesman, Sainsbury’s Head of Beer, Wine and Spirits. For the first time Allan came face-to-face with the details of where shrinkage was slicing an annual sum of €8 million (£5m) from his category’s profits. One action taken by Allan and Sainsbury’s Loss Prevention department was to turn to the six key suppliers whose products accounted for the majority of in-store shrinkage and ask them how they intended to respond to the problems that had been uncovered.
Whilst losses at Sainsbury’s significantly affects its own profitability, the effect of these losses is also felt by the BWS brand owners. Although the brand owners may be insulated by the retailer from the direct impact of this loss, they are under increasing pressure to become involved in methods to reduce the cost of shrinkage (such as EAS source tagging10).
For the ECR community as a whole, levels of stock loss are quite frankly alarming and demands immediate action. However this case study of losses in Sainsbury’s BWS category highlights the main problem facing retailers and suppliers at large. The telling symptom, as highlighted by Allan Cheesman, is that, ‘stock loss has been a ‘cause célèbre’ for over twenty-five years.’ Whilst today’s losses are a significant drain on profits, the key issue is the failure of current approaches in stemming this loss.
Waking up to the need for a new approach to loss prevention, Sainsbury’s and their key BWS suppliers chose to undertake a comprehensive review of BWS losses across the supply chain using the ECR approach. Working to an ambitious timescale, effort was focussed on ‘Hot Products’, i.e. those that appear in Sainsbury’s top 10 list of lost SKUs, from Allied Domecq and Diageo. This effort was also limited to an investigation of two retail outlets.
ECR Road Map Points the Way
The project was undertaken with Sainsbury’s, Diageo and Allied Domecq as contributors and Bacardi Martini, Pernod Ricard, First Drinks Brands and Maxxium as additional sponsors. The project made full use of the ECR shrinkage reduction Road Map, embracing its emphasis on loss prevention through increasing supply chain integrity. By removing loss caused by administrative errors and damage, the opportunity for theft and fraud is reduced and attempts to undertake criminal activity become more visible. Thus the approach attacks all the key causes of loss.
Application of the ‘Map and Measure’, ‘Analyse’ and ‘Develop Solutions’ steps of the Road Map was undertaken at the production facilities, distribution centres and two stores in line with the requirements specified in the project brief. The steps of the Road Map were undertaken as follows:
Map and Measure: Physically visit each facility along the supply chain and identify and classify the stock loss risks associated with process failure and theft from the facility.
Analyse: Undertake ‘Failure Modes and Effects Analysis’ of the process to identify key risks to process robustness. Undertake a Cause and Effects Analysis of the key risks to identify underlying causes of key risks.
Develop Solutions: Develop solutions and compile them into a list of provisional recommendations on actions that, when implemented, should remove or mitigate the underlying causes of a number of the key risks to process robustness.
Understanding Effects on Operational Robustness
As products move through the supply chain, three key factors compound the degree to which they are at risk: the number of SKUs, the degree to which irregularities are visible to the organisation and the extent to which audit checks are carried out.
At the head of the supply chain, in the bottling plant, the number of SKUs being produced is relatively small (usually less than 150). In addition, products are produced specifically to fulfil a particular customer order. In the case of the SKU’s followed along the Sainsbury’s BWS supply chain, these orders are produced, stored and shipped in full truck quantities. With each case on each pallet already assigned to a customer, combined with a straight forward process of supply, errors are quickly noticed. In addition to this operational visibility is a culture of auditing and checking products that results from the necessities of complying with and being accountable to HM Customs and Excise (HMC&E).
The production operations at both Allied Domecq and Diageo proved to be exemplars of operational robustness where opportunities for process failure and theft are minimised and the few errors and discrepancies that do occur are easily identified and resolved. The advantages of these characteristics are becoming increasingly sought by a variety of companies, a number of which have paid the complement of benchmarking their operations against the ones investigated here.
When products reach the supplier DC, the complexity of the supply chain generally increases for example through greater numbers of SKUs being held in the warehouse. This increase in complexity slightly increases the risk of process failure and theft, although the influence of Customs and Excise remains and auditing of stock is seen as a high priority. Maintaining robust control of the stock continues to result in low levels of loss.
A more diverse and larger range of SKUs are held in a bonded retail DC. Operational complexity increases once again as deliveries are received from a number of different providers. The number of ‘customers’ is also much higher as is the frequency of deliveries. Most outgoing orders are based upon cases, not pallets so the number of handling operations conducted in this environment increases significantly. However, the Customs and Excise influence continues to prevail and the checking of in-bound stock, stock held in the warehouse and outgoing orders is still a priority. While losses at this stage of the supply chain are higher than in previous stages, they are still relatively low.
A critical watershed in process robustness is reached when stock is either moved to an unbonded retail DC or to a store. In both types of facility the number of SKUs rises dramatically as does the normality of seeing open cases around the facility and individual items being handled. Hence the ability to spot irregularities is considerably reduced. At the same time, the degree to which audits and checks are carried out reduces. Therefore the risk of process failures is higher whilst the practices to identify, trace and resolve them are poorer
The Impact of Customs and Excise – A Culture of Accountability
The responsibilities imposed by the necessity to meet the rigorous and potentially costly requirements of the auditable standards of Customs and Excise should not be underestimated. Suppliers and bonded retail DCs operate in an environment where any losses need to be quickly identified and recorded otherwise the financial penalties can be severe. This has created a culture of accountability and checking where good quality inventory records are seen as an absolute necessity. The same cannot be said for stock held in unbonded environments.
There are a number of factors that make transferring such a culture to the store environment difficult, not least the added complications of the sheer number of SKUs in stock and the greater difficulty of physically tracking stock and noticing loss. However, there is a strong argument for investigating how a HMC&E type culture might be imposed upon the post bonded retail environment.
Site Threats
In addition to the factors outlined previously, two pairs of operational features of the supply chain are important in understanding the risk of theft. These are (i) motivation and opportunity and (ii) risk and consequences.
Motivation
Motivation is an important factor in affecting the likelihood to offend by those working in the supply chain. There are three factors which need to be considered when assessing motivation: acceptability, neutralisation (or excuses) and marginalisation. Acceptability is associated with whether the dishonest act is perceived by the offender to be wrong. For instance, if staff do not consider particular practices to be dishonest, or they see managers or supervisors behaving in a dishonest manner, such as eating stock on display, then this can legitimise the act. Offenders may utilise a form of neutralisation whereby the theft of goods or money is considered to be victimless and hence nobody really suffers. Thieves who seek to neutralise the effects of their crimes often excuse their act by using explanations such as ‘well the company can afford it’. Finally, marginalisation within the company may have a role to play in explaining why some staff become dishonest. Staff who are on short-term or part-time contracts, or see no obvious path of promotion may consider themselves ‘temporary’ employees within the work environment and hence perceive themselves to have less to lose if they are caught committing dishonest acts. Those most frequently caught for staff theft include young, part-time employees who have been with the company for a relatively short time and do not see themselves staying with the organisation for very long. This perception of an employee’s position within the company may be the critical variable in explaining their likelihood to become dishonest.
Opportunity
Opportunity is of critical importance and is based upon three significant factors: space, time and position. Space is associated with opportunities provided by particular parts of the working environment – a survey of retail staff found that a majority identified ‘backroom’ areas as offering an ideal opportunity to steal goods, primarily because staff were often on their own. Similarly, managers legitimately enter all parts of the store without raising suspicion. For external thieves, ‘blind spots’ within stores, such as behind pillars or areas that are not readily observable by staff or CCTV can provide opportunities for theft. Time is also an important factor of opportunity. If particular members of staff work at times when there are either lower levels of supervision or there are very few or no other staff present (such as night shifts), then their opportunity to steal is higher. In addition, shoplifters may chose times when they know a retail store has very few staff working, or when the store is particularly busy, when other shoppers provide ‘cover’ for their offending. Finally, position or role in the company can provide staff with the opportunity to commit crime. Positions of responsibility and or specialisation can offer staff the opportunity to be dishonest (for instance buyers or IT staff).
Risks and Consequences
Sanctions or disincentives to commit crime influence the likelihood to offend. These are the perceived chances of being caught and the consequences of any subsequent punishment. If offenders consider the risk of being caught as low then this acts positively to encourage dishonesty. Similarly, if the punishment is relatively lenient then this also acts positively to encourage theft. Alternatively, if potential offenders consider themselves at significant risk of being caught and appreciate that the punishment will be severe (loss of job for instance or a criminal record) then this acts as a powerful disincentive. In addition, offenders need to decide whether the rewards are sufficient and the prospects of being caught low enough to proceed with the offence.
Quantifying Site Threat
Taken together these variables help explain and quantify the threat of theft by staff. It is important to remember that these factors work both in isolation and in combination depending on the particular offender and the circumstances surrounding the incident. Indeed, for some offenders there are powerful factors that act positively to encourage dishonesty while at the same time other factors act in the opposite direction and in effect cancel each other out.
When these factors are applied to quantify the threat of theft at the various stages of Sainsbury’s BWS supply chain, it can be seen that as products move along the chain there is an inverse linear relationship between the four factors and the location of the product.
- Motivation to commit offences increases.
- Opportunity to commit offences increases.
- The perceived risk of being caught committing an offence reduces.
- The perceived consequences of being caught committing an offence reduces.
Losses Concentrate on Hot Products and in Hot Stores
Examining the distribution for loss per SKU across the range of individual products revealed a telling profile. This is the signature of the ‘Hot Product’ phenomena. In this project, 30% of losses were found to occur on 8% of the items stocked and 50% of loss incurred on 20% of items. When seeking to control and eliminate loss, it makes sense to apply effort on these few, vulnerable stock items In addition to the ‘Hot Product’ phenomena observed for the BWS category, examination of the level of loss per store reveals another phenomena: the ‘Hot Store’. This indicates that across the estate, the distribution of loss is skewed onto a small number of stores. Specifically it seems that half of all spirits losses occur in 18% of stores. This being the case it would seem that focussing attention onto these stores in the first instance would deliver the greatest return.
Conclusions
On the basis of this examination across the supply chain it was clear that the supply chain from bottling plant to store is generally secure. In the case of the supply chain operations, we drew our conclusions mainly on the basis of an examination of process robustness as there was an insufficient data on the levels of loss in the retail distribution chain. Despite this, it was felt safe to conclude that, ‘the store is the problem,’ indicating that this is where the weight of attention should be applied.
Considering the practices employed in the stores to prevent loss from the perspective of both operational efficiency and loss prevention, it appears that they are generally not effective.
Turning Research into Action
Most criminological research shows that shoplifters are deterred by increasing their perceived risk of being caught and subsequently punished. There are several elements within the store that need to be considered to achieve this increase in risk:
- .Accountability for stock loss in the BWS department needs to be assigned. This person will ensure that loss prevention practices and procedures, such the recommendations listed below, are implemented and maintained. Making the BWS department leader a more senior position would help achieve better ownership of the need to drive sales up and lower losses. The recent introduction of ‘OffLicence’ Managers to selected stores (presumably with profit and loss responsibility) meets this need for the allocation of accountability.
- Staff need information on which products suffer stock loss for them to take appropriate action. They need to know which SKUs are most vulnerable to loss (through access to high quality loss data) so that they can be ‘present in the aisle with a purpose’, increasing their likelihood to deter offenders.
- A good way to make sure staff are aware of the vulnerability of particular products is through gathering data. Store staff were undertaking a practice of counting the stock on the shelves and recording the quantities put out on display, the number of items sold and the number that were lost. However the procedure for recording these numbers was ad-hoc and not always undertaken. For this laudable procedure to be effective, it needs to be systematic and undertaken consistently. Therefore the store staff require a more professional, centralised and properly resourced approach. Not least, the staff need a proper log-book in which to record the data and they need to have easy access to sales data. Finally they need to review the information they collect, at least every week, to identify incidents and trends and to plan how they will take action to tackle problems. These plans should be reported to the store manager on a weekly basis.
- Using the in-store CCTV system in conjunction with the data on losses gathered through the counting helps identify persistent offenders. Shelf counting reduces the time between loss happening and store staff becoming aware of it. By knowing the time window in which the loss occurred allows CCTV footage to be reviewed with the aim of linking likely offenders with missing stock.
- Use the in-store security guard to carry out the above process, which will provide a more interesting mix of activities for the guard and increase their motivation.
- Store staff were undertaking a practice of stamping high value spirits with the store number and address. There was no evidence that this has the effects that store staff implied it had, e.g. ‘enables police to recover stolen stock to the right store,’ ‘stops offenders claiming the stolen stock was purchased at another Sainsbury’s store’. The savings in staff time could be used to more effectively audit the stock on the shelves.
- The use of EAS tags was found to be wholly ineffective in dealing with the off-shelf theft of bottled spirits by customers for a number of reasons:
• The tags and the alarm system are poorly advertised, hence offer little deterrent.
• The tags/alarm system is easy to defeat by disabling the tag or shielding it from the alarm gates.
• The tags are easily overlooked by till staff, who fail to disable them, which causes the system to be inadvertently activated and further reduce staff confidence in the system. - Finally, it seems appropriate to consider bottled spirits as candidates for trials with EAS ‘hard tags’. The hard tags seem to address many of the problems highlighted above. Hard tags are large items, therefore they offer a visible deterrent to theft. They are also of stout construction, making them difficult to disable. Being fairly large, these tags should not be overlooked by the check-out staff and therefore are more likely to be removed, preventing false activations of the alarms.
Implementing Recommendations
Trial Changes to Operations, New Methods and Technologies
The comments made, conclusions drawn and recommendations suggested were intended to stimulate thought and promote action amongst Sainsbury’s and their BWS suppliers. It was however necessary to add a health warning to this research, which applies to all companies seeking to reduce stock loss. The deployment of new thinking needs to be both embraced and treated with caution. This is also true when the action is not to start something new but to cease something that is currently being undertaken, for example to stop the stamping of spirits bottles with the Sainsbury’s store number.
Accordingly, the recommendation was made that operational changes should be deployed firstly in a planned series of rigorously performed experiments, in keeping with the methods described in the ECR Road Map.
Perform Rigorous Experiments
In order to reveal the true effect of new approaches to loss prevention it is imperative to break away from the age-old loss prevention culture of opinion and anecdote. Decisions need to be made on the basis of robust, data rich evidence. The first stage of these ‘experiments’ is to perform a thorough ‘shake down’ test on these new ideas. Put simply, they need to show they can stand up to the rigours of the workplace. The second stage is to acquire ‘investment grade’ data. Key to getting the necessary data on which investments can be made with confidence is to ensure robust experimental design. This requires the construction of a proper trial, with a control group, and the results assessed with appropriate statistical tools.
Quantify Impact on Losses and Sales
Finally, having made the investment in time and money, the financial impacts of the ideas need to be audited in order to learn and move forward to tackle new challenges.
Tesco and Gillette
Hungary
Lessons for the ECR Community
The Tesco/Gillette project demonstrated impressive results. Sales increased by 288% and stock loss reduced by 74% in the three stores where the pilot project was undertaken. Both companies considered the project was a success and the solutions developed by the project team are being rolled out across Tesco’s estate in Hungary.
In addition to the benefits to Tesco and Gillette, this project provides several lessons that should be useful to the wider ECR community. These relate to the role of collaboration, the factors that influenced success in the project and the need for objective performance measurement.
The collaborative approach is not an excuse for avoiding the key issue of delivering quantified financial benefits. As Tesco and Gillette clearly demonstrate, collaboration is an enabler for raising each company’s individual profitability.
The Road Map provides a pragmatic approach to improving product availability. The success of this approach lay in its ability to generate commitment amongst the people who become involved with the project. This commitment is a key factor in ensuring the success with which solutions are implemented.
In order to make sound business decisions, particularly when faced by the emotive subject of shrinkage, objective performance measurement is vital. This is true at the start of a project as well as the evaluation step at the end.
Introduction: A Trio of Success – Retailer, Supplier and Nation
The success of Tesco, and indeed theirs is a story of retail success, is based on a ruthless focus on delivering shopper satisfaction. Critical to the success of this mass appeal retailer is their ability to achieve:
- Economies of scale.
- Minimised operational cost.
Economies of scale only come by attracting and retaining shoppers. These customers are the heart of the business, around which the infrastructure to serve them in the most cost efficient manner is built. In common with other mass appeal retailers, Tesco underpins the ability to serve shoppers in a cost efficient manner with an efficient distribution network and extensive estate of hyper and super size stores.
In a parallel story of success, the Gillette Group established and maintains a healthy position in the grooming category through the appeal of its products. A series of product innovations has captured consumers’ imaginations leading to high levels of loyalty for Gillette’s premium brands shaving systems such as Mach 3 and Venus.
The third element in the trio of success is Hungary itself. Following the end of the Cold War, symbolically represented by the Berlin Wall coming down, both Tesco and Gillette were keen to bring their respective expertise to the people of CentralEastern Europe. Amongst the first countries to embrace democracy and free market economics was Hungary. With a well-educated, multi-lingual and motivated people the Hungarian economy demonstrates strong growth with GDP per head levels increasing rapidly.
Crisis on the Shop-Floor
Against the steady and impressive progress experienced by Tesco and Gillette in Hungary loomed a crisis. Losses of Mach 3 replacement blades, Gillette’s premium male grooming product and Tesco’s major sales generator in the men’s grooming category, were running at dramatic levels in a number of stores. Tesco were not just losing margin on listing these items, they were losing money. Taking a pragmatic view, many Tesco store managers were defensively merchandising Gillette’s premium products by taking them off open sale. However not only did this action significantly reduce sales, shrinkage continued to run at unacceptable levels. As a final response to this problem Tesco’s senior managers concluded that unless matters were turned around within 14 days Gillette’s premium products would be delisted.
What happened to Collaboration?
Collaboration is the mantra of the ECR movement. Both Tesco and Gillette are keen supporters of ECR. However, collaboration seemed an unaffordable luxury with profits at stake, which is why Tesco was prepared to stem their losses in such a dramatic fashion. With hindsight, it was clear a definition of collaboration was needed. The solution was found to be:
Collaboration: ‘Businesses achieving their individual goal of maximum appropriation of value, mutually.’
Send in the Road Map
Tesco and Gillette had a considerable amount of common ground, not least:
- Focus on financial results: A need to deliver profits in line with targets.
- Need for solution: doing nothing was not an option.
- Action must be taken quickly and decisively
This common ground set the context in which the ECR shrinkage reduction Road Map was used.
The Road Map responds to the real-life circumstances faced by retailers and suppliers. This project was no different. Above all, the Road Map ensures that an investigation into an emotionally charged circumstance is undertaken in a systematic and robust manner. This ensures that the true nature of the shrinkage problem is highlighted, the underlying causes of stock loss are identified and appropriate solutions developed and implemented. Collaboration is a key element in the success of this approach and was achieved in this project by drawing together a capable team with people from both companies and who had access to additional subject experts as required.
The investigation into the losses at Tesco started by first mapping and measuring the supply chain. This investigation revealed that losses were concentrated on just a few items (references; SKUs). Thieves were clearly targeting these Hot Products. Further analysis revealed that the loss of these items was concentrated in a few stores, the so-called Hot Stores. This focussed the efforts of the project team onto responding to the losses of Hot Products in these Hot Stores. This involved conducting a detailed examination at these Hot Stores into:
- The ordering process and inventory recording system.
- The physical supply of goods into the store.
- The storage and protection of goods inside the store.
The systematic review of the supply chain from the Gillette Distribution Centre, to the Tesco Depot (a distribution centre), to the stores and finally to the shelves revealed a total of 150 areas of risk. These occurred at various points in the supply chain where the process and its associated procedures lacked control. The risk at these points was that product could be lost through process failure. The risk that process failure can occur provided the opportunity for theft to occur and not be discovered.
Solving the Problem in 10 Easy Steps
The work of the Tesco/Gillette team is captured in the solutions they developed. Clearly illustrated in the video that accompanies this case study (see CD), the 10 steps are grouped into three areas:
- Secure the ‘Hot Product’ Supply Chain.
- Secure In-Store Handling.
- Define Ownership and Control of Loss.
Secure ‘Hot Product’ Supply Chain
Hot Products are the focus of attention by individuals who shoplift or pilfer for their own use or use by acquaintances. Hot Products are also the target for organised theft, whose aim is to convert the product into cash. The strong brand awareness and product loyalty that was established by Gillette for their Mach 3 line made it a target at Tesco. In order to deny organised thieves the opportunity to steal large quantities from the supply chain it was necessary to secure the supply chain. Three measures were implemented to achieve this:
- Sealed pallets from DC to outlets.
- Each product movement checked & documented.
- Products fast-tracked into secured storage locations.
Secure In-Store Handling
Key to the team’s thinking was to consider delivery to store and in-store product handling as being an extension of the supply chain. Best practice from secure supply chain operations were therefore applied to the store operation, in particular:
- Controlled and frequent replenishment between secure storage and shop-floor.
- Visible display location.
- Anti-theft fixtures
Defined Ownership and Control of Loss
Most companies recognise that their staff are their most significant resource in achieving business success. Tesco and Gillette certainly embrace this point of view. They also recognise that a significant proportion of shrinkage is due to internal theft. This final set of solutions brings the employees into the front line of shrinkage reduction. It also uses the awareness of the trustworthy majority of staff to ensure that their rogue colleagues are quickly identified:
- .Stock loss results owned by in-store champion.
- Staff awareness.
- Ongoing control through regular stock counting (front and back of store).
- Measure and adjust.
The ‘George Effect’
When asked to put a finger on a single reason for the success of the work between Tesco and Gillette, one word came to mind, ‘George.’ Gyorgy Ruszkovszky is Product Availability Manager for Gillette Hungary. Amongst the many able people that worked on this project, George’s input to the team provides a lesson to anyone embarking on a similar project. The reason that every project team needs someone like George reflects the simple truth that projects never go exactly to plan. Hence the need for a ‘George’, who ensures the following:
- Focus on the delivery of objectives.
- Access to local knowledge, i.e. the right people to turn to for help.
- Persistence in the face of apathy.
Whilst his input was generally discreet, looking back over the project it is clear to see George’s ‘finger prints’ at all the key points.
Focus on Results
To return to where the project started, both Tesco and Gillette needed hard results and evidence to show that the crisis was being brought under control. Results from an implementation of the 10-step set of solutions in three ‘Hot Stores’ were compelling. These results are shown below in Table 10.
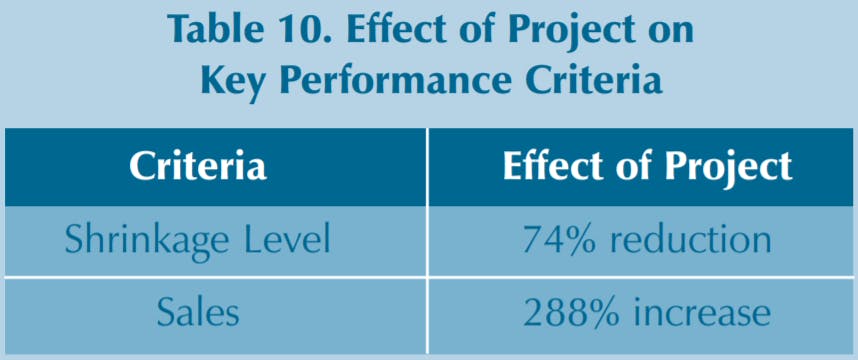
The level of shrinkage went from being at crisis level before the project to below 2% afterwards. Sales rose dramatically as a result of open merchandising and of improved on-shelf availability as inventory records became accurate. Above all, there was a dramatic improvement in the profitability to Tesco of retailing Gillette product. A true WIN • WIN outcome to the project.
In addition to the hard benefits of the project, additional but unquantified benefits were achieved. For both companies, their supply chain was brought under control and stock handling procedures became more transparent. The success of the methods used to handle Mach 3 at Tesco led to these methods being transferred to other Hot Products, in particular cigarettes.
Roll Out
Having achieved notable success in three stores, Tesco and Gillette invested in a programme to roll out the ten-steps across Hungary. To date, all of Tesco’s Hungarian 26 stores have received training on the solutions tested in the pilot stores as well as follow up visits to monitor progress. These visits have found 20 of the stores (80%) are following the 10 step procedures. Difficulties have been reported in achieving 100% compliance for a number of reasons. Ironically, one significant factor is that the success achieved by implementing the solutions means that management attention diverts on to higher priority issues. The challenge is therefore to maintain over time the procedures that ensure product remains availabile and losses continue to be prevented.
Wickes, Lloyd Fraser and GET
United Kingdom
Lessons for the ECR Community
For Wickes, GET and Lloyd Fraser their ECR project proved effective in reducing shrinkage. In addition to this key result, each company found additional, spin-off benefits from their investigation, which they attributed to having followed the Road Map. For example Lloyd Fraser found that GET disposes of the same type of cardboard boxes that it buys. Now the two companies exchange these boxes, in a mutually beneficial arrangement. GET also benefited by benchmarking Lloyd Fraser, acquiring new ideas for its warehousing operations. By collaborating on this project all three companies were able to achieve a range of benefits. Clearly an example of WIN • WIN • WIN.
This project was undertaken on a supply chain for home improvement (DIY) products. By undertaking this work in a new sector, the project serves as an example of the ability of ECR to benefit companies beyond its traditional constituency in the FMCG and grocery sector. The project also reveals the benefits of extending collaboration to include the third-party logistics service provider (3PL) in an ECR project, in addition to the usual combination of retailer and supplier.
Introduction: ECR Breaks New Ground
The project work by Wickes, Lloyd Fraser and GET broke new ground for the ECR community in two important ways. Firstly, this project focussed on the home improvement sector, a welcome addition to ECR’s traditional constituency of FMCG grocery retailing. Secondly, this project extended the ECR principle of collaboration beyond the usual pairing of retailer (Wickes) and supplier (GET) to include the third-party logistics service provider – 3PL (Lloyd Fraser).
98% of the products sold by Wickes are ownbranded, which avoids the excesses of shrinkage associated with strongly branded product lines usually found in the FMCG sector. This own-brand strategy also offers a degree of protection against product being stolen from Wickes and then sold through other retail outlets. The own-brand approach also prevents non-Wickes products being returned to Wickes for refunds. However, in keeping with other retailers, some product categories carried by Wickes suffer above normal losses and within categories losses tend to concentrate on a few Hot Products.
GET are a major supplier of electrical items to Wickes, other home improvement retailers and the building trade in general. Within their product range, some items are small in size, high in value and have a broad range of domestic and commercial uses. The ability to dispose of these products into the professional building trade makes them targets of organised theft whilst their usefulness in DIY projects means they are also at risk from pilferage.
The third organisation in the project is Lloyd Fraser, who manage and operate the warehousing and distribution services for Wickes. They are accountable for ensuring the integrity of the supply chain and protecting assets from the pick-up from GET through to delivery to Wickes stores. They are also a key contributor of knowledge to the project team given their understanding of supply chain operations and the associated interactions between retailer and supplier.
Shrinkage Crisis Shock – There Wasn’t One!
Unlike the majority of shrinkage reduction projects brought to the attention of the ECR Shrinkage Group, the genesis of this project was not a crisis. Instead, Wickes had recognised and highlighted shrinkage as an opportunity for tighter cost control. More to the point, Wickes launched their project with stock loss levels below the target that most retailers aspired to achieve.
Despite their already impressively low levels of shrinkage, a steering group of directors from all three companies agreed that reducing shrinkage still further would bring financial benefits. This tricompany steering group set the brief for the project and held regular meetings to review progress in achieving the project’s objectives. Responsibility for delivering the objectives was devolved to a project team made up of a single, senior manager from each team. A good account of this team structure and the motivation of the three companies to invest resource into the project is given in the video that accompanies this case study (included in the CD).
With hindsight it is clear to see the benefits that arose from this choice of project team membership and the reporting structures with the project steering committee. By having a small core team, communication within the team was very effective. Staffing the team with senior managers put their experience and knowledge at the heart of the team, instead of at the periphery. These were also the right people to call on their informal network of contacts within their own companies who could provide specialist inputs when the need arose.
The role of the steering committee was to coordinate the project across the three companies at a supply chain level, monitor progress, release the necessary resources so they were available to the project team and to look to the project team to inform their thinking.
Hot Spots in Well-Run Supply Chain
Following the Road Map, the team meticulously documented the physical flow of product through the supply chain as well as the paths that information took. Measures were taken of discrepancies in deliveries between sites and in the inventory counts within individual sites. These were complemented by assessments of the other key performance indicators such as put-away and picking accuracy within warehouses.
The information gathered during the Mapping & Measurement step of the Road Map was indeed thorough. When the project team presented their work at the 2002 ECR Congress in Barcelona, a 4- metre long process map greeted delegates. This process map illustrated what the project team achieved by their thorough research: a unique insight into the structure and performance of their supply chain. The team themselves made the tongue-in-cheek remark, ‘It’s a wonder that we manage to deliver anything.’
Systematically analysing the information gathered revealed a key finding:
Even within a well-run supply chain, there are Hot Spots where products can be lost.
In keeping with the underlying philosophy of the Road Map, these supply chain Hot Spots are the places where stock is lost through process failure, which in turn provides the opportunity for loss through theft and the possibility of fraud.
Investigation into the root causes of why Hot Spots existed led the project team to construct a list of 44 recommendations. These recommendations can be summarised under four heading:
- Introduction of new product handling and information gathering procedures.
- Enhancements to IT systems.
- Re-brief existing best practice.
- Change existing priorities for investment and development.
In general these findings fall into two groups, new understandings and things that the companies already knew. The new understanding occurred by following the ECR Road Map approach of taking a holistic view across the whole supply chain. This revealed situations such as where each company thought the other was doing vital checks on deliveries, when in fact none of them were. In some cases the process was fine but the accompanying procedures were not being followed correctly. To ensure the supply chain was robust, it was clear that both product flow and the accompanying information flows needed to be synchronised.
In many cases the companies were already aware of the issues and had practices that were able to control them. However a number of the issues were viewed in isolation and best practice was not being followed consistently. Taking a holistic view highlighted the need for best practice to be universally implemented and for high standards of control to be ubiquitous across the distribution and store network. In order to achieve widespread best practice some existing investment plans were rescheduled.
Investment Grade Data
A major asset in Wickes’ control of shrinkage is the quality of their data. Data is available and readily accessible as a resource to inform management decision making. In that respect here is a company that embraces data-led management, a refreshing change from the worst cases in loss prevention that can consist of ‘management by anecdote.’ In true style, Wickes has tracked the performance of losses on GET products since implementing the series of improvements. Unlike other projects, these improvements were not implemented at pilot locations. Instead they were implemented across the whole estate. Therefore in order to assess the impact of the actions taken, the shrinkage of GET products was compared against Wickes’ overall shrinkage level. This comparison was undertaken for the period before the improvements were implemented and then again for the period after the improvements were implemented. The following data was used to make the evaluation:
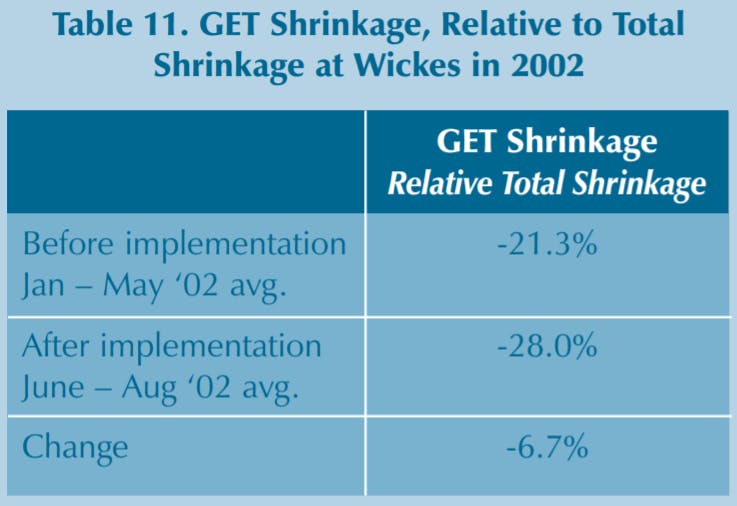
Table 11 show the level of shrinkage of GET products within Wickes, relative to the overall level of shrinkage for all products. The recommendations were in place by the start of June 2002. The level of shrinkage for GET products compared to the shrinkage level for Wickes as a whole was assessed for two time periods: January to May and from June to August (last date data was available), i.e. for before and after the implementation.
In the period of January to May, prior to the implementation, shrinkage in GET products ran at 21.3% below the total. After the project, in the period June to August, the shrinkage in GET products was 28% below the Wickes total. There was therefore a drop of 6.7% in the shrinkage of GET products, relative to the Wickes total, between the periods before and after the implementation.
Given the seasonal nature of the home improvement market, it was felt necessary to conduct a similar analysis on the data for the previous year, 2001. This sought to discover whether there is a natural drop in the shrinkage level in GET products in the June – August period, compared with the January to May period.
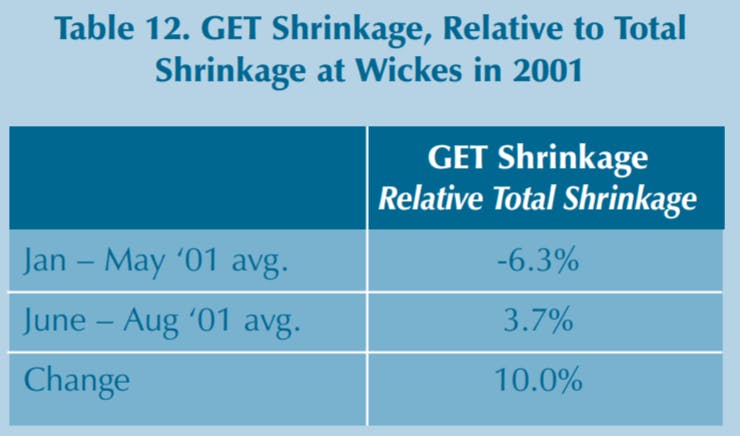
The data from the analysis of the relative level of shrinkage showed that in the January to May period in 2001, losses on GET product were 6.3% below the trend. The losses for May to August in 2002 were 3.7% above the trend. There was therefore a relative increase in shrinkage in GET products of 10% between the two time periods in 2001.
These findings indicate that the loss reduction solutions implemented by the project team led to a relative decrease in shrinkage for GET products. This conclusion gains validity by contrasting the pre and post implementation data for 2002 against data from the same time periods in 2001. This analysis gives results that are consistent with there being a causal relationship between the solutions that were implemented and the level of shrinkage for those products.
Roll-Out
Having reviewed the effect the ECR project had on performance in general, and shrinkage in particular, Wickes is rolling out the ECR approach with their other major suppliers. In a similar vein, GET is applying the lessons it learnt to its other major customers. Likewise, Lloyd Fraser has been able to deliver benefits to other clients by transferring best practice learnt from this project.
Coop Italia and Procter & Gamble
Italy
Lessons for the ECR Community
Although it was not possible to measure the effect of their efforts in terms of changes in stock loss and sales both Coop Italia and P&G point to a number of benefits from conducting their ECR pilot project. Undoubtedly the project team benefited considerably from containing a broad range of people with experience from across the supply chain. Using this level of people was a major commitment by Coop and P&G but a commitment that proved to be worthwhile.
A finding that should be noted by others in the ECR community relates to the applicability of EAS tagging as a method of loss prevention/reduction in this project. Whist Coop began the project with the preconception that EAS6 tagging was the answer, their investigation of the supply chain revealed that the major causes of shrinkage were not off-shelf theft. Instead the major problem was found to be poor process control in the supply chain. EAS was shown to be only one of many solutions to a problem that these companies faced in only a minor way.
Only through their holistic approach to understanding shrinkage was the project team able to gather the information and undertake the analysis necessary to identify the sources of stock loss. Having done this, efforts are being brought to bear on the supply chain Hot Spots and appropriate solutions developed. In general these solutions involved bringing the supply chain under control through process and procedural improvements.
Introduction: Cultural Diversity
The Italian grocery sector is a reflection of Italy itself: diverse and sophisticated. Coop Italia is the biggest retailer in Italy. The Coop culture devolves control of the business to autonomous business units. The head office role is therefore not one of command and control. Instead, the head office coordinates areas of mutual interest on behalf of its members, for example to leverage economies of scale in purchasing and to promote and support the achievement of standards.
P&G is one of a handful of FMCG/CPG7 suppliers that is truly multinational. They possess the capability to supply market-leading brands throughout the world with a ubiquitously, high level of service. The company’s corporate structure reflects the need to live up to these values throughout their value chain, throughout the world.
Willingness to Use the Road Map
Coop Italia and P&G have a tradition of cooperation on a range of business initiatives and promotional campaigns. The objective in working together on a shrinkage project was set by Coop to resolve a stubborn problem of shrinkage in P&G’s Infasil product line. At the outset of the project there was a perception at Coop that the problem would be solved through the use of Electronic Article Surveillance (EAS) technology. Despite this the team avoided jumping to conclusions by embracing the ECR shrinkage reduction Road Map, using it as a structured approach to direct their problem solving efforts.
The challenge facing the Coop/P&G team was the need to conclude their project with compelling recommendations. The Coop culture of devolving decision-making means that individual store managers have a major influence over the implementation of recommendations made by the project team. The systematic, holistic approach of the Road Map was therefore vital in being able to create recommendations that can be justified to these decision-makers. Likewise, the project team needed to be made up of people with the respect and trust of their peers. For this reason, the project team included people from across the P&G and Coop operations. This broad team contained people with experience and expertise in the areas of supply chain, IT systems, security and store operations.
Data-Led Decision Making
The investigation involved a holistic review of the supply chain. As a result of this investigation, the team identified 143 steps in the process from the P&G distribution centre through to the shelves of Coop stores. Undertaking a Failure Modes and Effects Analysis of the process, 40 steps (almost 30% of the total) were identified as containing risks. By going through the process step by step, the team identified numerous weaknesses that could lead to shrinkage through process failure. The significance of this finding was not lost on the project team. As the team members themselves said,
‘To be honest, if we had more time we could have been even more detailed in our investigation. However, even with the limited time we had we are sure that all the people that contributed to the project and that manage the operations are now more conscious of the consequences that poor process standards and poor management have on losses along the supply chain.’
Tackling Shrinkage Through Process Control
The challenge facing the Coop/P&G team was to make an effective impact on the shrinkage problem. Having gained an understanding of the risks in the supply chain and analysed the root causes of these risks the team used a series of criteria to guide them. These guiding criteria were:
- Focus on biggest problems.
- Develop solutions requiring Coop – P&G collaboration.
- Look for process and procedure simplification.
- Focus on solutions that are quick to implement.
The biggest problems in the supply chain were a small number of Hot Spots. In general, the Hot Spots were points in the supply chain where accountability for the products changed hands and also where process control was poor. The team chose to deal with issues that needed collaboration between the companies. Issues that were entirely within the control of one company or the other were noted but left to internal improvement teams to respond to.
Having focussed their attention on the supply chain Hot Spots, the project team looked for solutions based around process and procedural simplification. The rationale was that a simple process is easier to control and more productive. Failure in a simple process is easier to detect, which make it easier to respond to and bring back within control. Simplicity is also a benefit to those people working in the process, so they are more likely to welcome and embrace the change. Finally, simplification is likely to require actions that are quick to implement, leading to rapid improvement.
The team identified a range of solutions, with priority given to the following four:
- Change Order Picking Procedures in P&G.
- Introduction of Sealing of trucks leaving P&G D.C.
- Change of Sealing Procedure of trucks in Coop D.C.
- Randomly checking seals on trucks leaving Coop D.C.
In addition to these solutions, the team identified areas where they needed to improve their understanding. In particular the nature of in-store losses lacked information. To help fill this knowledge gap two experiments were launched looking into the effect of:
- A warning message label on Infasil Deo.
- EAS tags applied at P&G to Infasil Deo.
Project Evaluation
Key to shrinkage reduction is to measure the effect of solutions that are implemented. In the case of the Coop/P&G project it was not possible to gather reliable information on the effect on shrinkage at the distribution centres or the stores involved in the project. Confidence in the shrinkage data that was collected is low and it was decided not to use this as the basis on which to draw conclusions on the project. In light of a lack of auditable results, it is possible to look to other metrics on which to judge the effectiveness of a project. These areas are listed below in Table 9.
As already mentioned, the auditable results were poor so it was difficult to quantify the new performance levels. However in terms of the other criteria, namely through the introduction of robust procedures, use of new tools and methods introduction of new process and reinforcing of ECR and company principles, the project delivered notable results. This success is reflected in terms of the soft results that were identified, where it was clear that the project resulted in:
- Relationship build up.
- Holistic operation understanding within each company and across the supply chain.
- Potential future collaboration on other projects.
- These results indicate that the project should be considered as being a success.
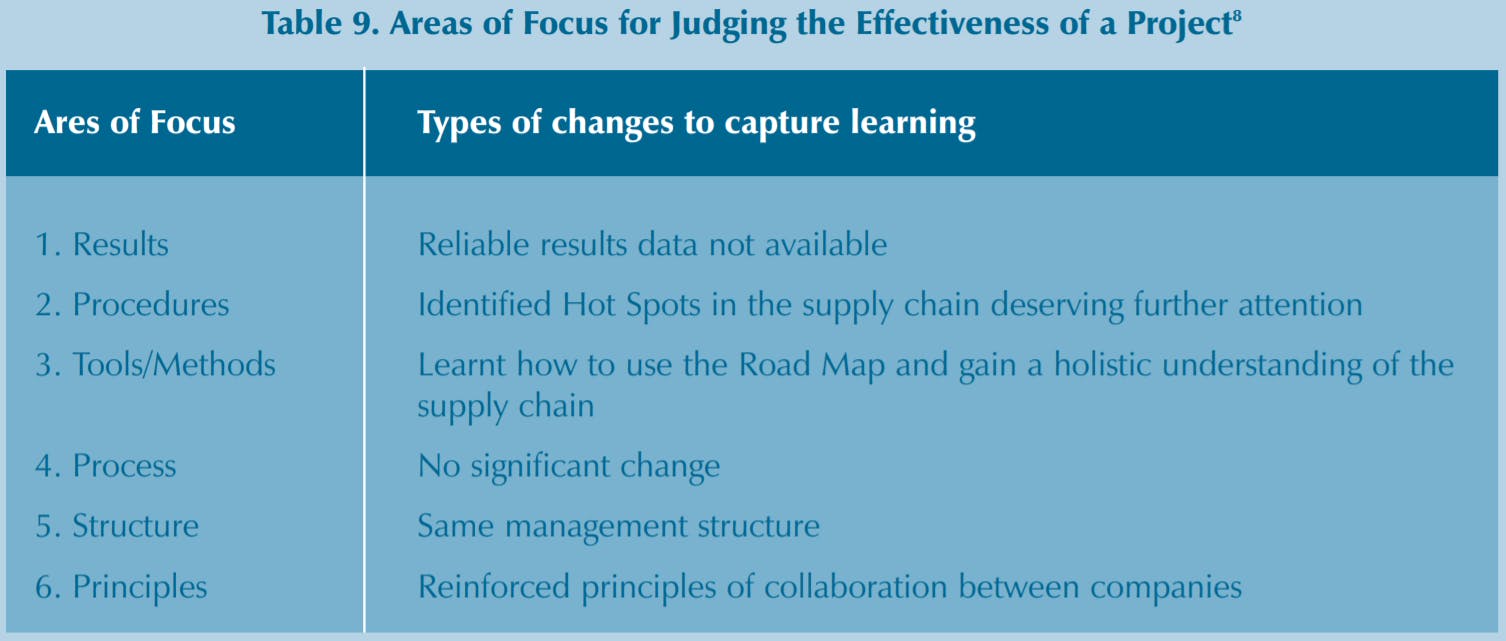


Main office
ECR Community a.s.b.l
Upcoming Meetings
Join Our Mailing List
Subscribe© 2023 ECR Retails Loss. All Rights Reserved|Privacy Policy