


Self-Checkout in Retail: Measuring the Impact on Loss
Measuring the Loss
Table of Contents:
- Abstract
- Foreword
- Executive Summary
- Introduction
- Background
- - The Rise of SCO Technologies
- - Utilisation of SCO and Risk
- - Competing Expectations: The Role of Loss Prevention
- Understanding SCO-related Losses
- - Key Drivers of Lost Profits
- - Challenges of Measuring SCO Losses
- Impact of SCO on Retail Losses
- - Losses Associated with Fixed SCO Systems
- - Losses Associated with Scan and Go SCO Systems
- Controlling SCO: Keeping Shoppers Honest and Accurate
- - Minimising Product-driven Errors
- - Amplifying Risk and Enhancing Detection
- Controlling Fixed SCO
- - Capable Guardianship
- - Utilising Technologies
- - Designing the Fixed SCO Environment
- Controlling Scan and Go/Mobile SCO
- Conclusions
- Developing a Framework to Manage SCO in Retailing
- Appendix: Methodology
- - The Collecting of Quantitative Data
- - The Collecting of Qualitative Data
- - Confidentiality and Presentation of Data
- - Limitations
Languages :
This report, published in 2018, focusses upon quantifying the risks associated with three forms of self-scan and checkout technology (SCO): Fixed (the consumer scans at a designated machine) Scan and Go (the consumer is provided with a scan gun by the retailer) and Mobile Scan and Go (the consumer users their own mobile device to scan items) (1). In addition, it provides a critical review of the various ways in which these risks might be controlled and managed.
It is based upon data collected from 13 retail companies and two SCO technology providers. Interviews were carried out with 73 key stakeholders from these companies and 11 store visits were conducted to review the technologies in use. In addition, a range of data points were collected from participating retailers, including: 140 million Scan and Go transactions; 17 million transaction audits; 486,000 items found not to have been scanned; video analytics of €72 billion of Fixed SCO transactions; and comparative shrinkage (2) data from thousands of retail stores. It is the most comprehensive study to date on the scale and extent of losses associated with SCO technologies.
The study provides the first ever independent assessment of the losses associated with various types of SCO systems. Developing a loss to use indicator, it suggests that for Fixed SCO systems retailers can expect that every 1% of transactional value will generate an additional 1 Basis Point of shrinkage (unknown stock loss). Given this, for a store with 50% of transactions being processed through Fixed SCO, it can expect its shrinkage losses to be 75% higher than the average rate found in Grocery retailing. For Scan and Go SCO the study found that the expected losses were likely to be much higher, in the region 10.4 Basis Points of additional loss for every 1% of transactional value. Moreover, the study found that utilising partial audit rescans to identify non-scanned products was highly unreliable – on average only 2.88% of audits found an error compared with full audit checks which found on average an error in 43.4% of baskets.
The research offer valuable insights on how retailers might begin to try and control the losses associated with SCO systems. Four key areas are explored: the role of guardianship, the utilisation of various technologies, changes in store processes, and the impact of how the SCO environment is designed. A detailed framework is also provided aimed at helping retail organisations develop more co-ordinated, cross organisational strategy for the management of SCO.
Abstract
This report, published in 2018, focusses upon quantifying the risks associated with three forms of self-scan and checkout technology (SCO): Fixed (the consumer scans at a designated machine) Scan and Go (the consumer is provided with a scan gun by the retailer) and Mobile Scan and Go (the consumer users their own mobile device to scan items) (1). In addition, it provides a critical review of the various ways in which these risks might be controlled and managed.
It is based upon data collected from 13 retail companies and two SCO technology providers. Interviews were carried out with 73 key stakeholders from these companies and 11 store visits were conducted to review the technologies in use. In addition, a range of data points were collected from participating retailers, including: 140 million Scan and Go transactions; 17 million transaction audits; 486,000 items found not to have been scanned; video analytics of €72 billion of Fixed SCO transactions; and comparative shrinkage (2) data from thousands of retail stores. It is the most comprehensive study to date on the scale and extent of losses associated with SCO technologies.
The study provides the first ever independent assessment of the losses associated with various types of SCO systems. Developing a loss to use indicator, it suggests that for Fixed SCO systems retailers can expect that every 1% of transactional value will generate an additional 1 Basis Point of shrinkage (unknown stock loss). Given this, for a store with 50% of transactions being processed through Fixed SCO, it can expect its shrinkage losses to be 75% higher than the average rate found in Grocery retailing. For Scan and Go SCO the study found that the expected losses were likely to be much higher, in the region 10.4 Basis Points of additional loss for every 1% of transactional value. Moreover, the study found that utilising partial audit rescans to identify non-scanned products was highly unreliable – on average only 2.88% of audits found an error compared with full audit checks which found on average an error in 43.4% of baskets.
The research offer valuable insights on how retailers might begin to try and control the losses associated with SCO systems. Four key areas are explored: the role of guardianship, the utilisation of various technologies, changes in store processes, and the impact of how the SCO environment is designed. A detailed framework is also provided aimed at helping retail organisations develop more co-ordinated, cross organisational strategy for the management of SCO.
Foreword
The ECR Community Shrinkage and On-shelf Availability Group is delighted to have had the opportunity to support this important and ground-breaking study. It provides an upto-date review of the potential impact of self-scan and self-pay technologies on levels of retail loss. In addition, it also offers insights into how retail businesses can begin to go about addressing the risks posed by them.
For many of our members and other retailers around the world who use these systems, I’m sure this will be a timely and welcome report. Retailing is becoming ever more dependent upon a host of technologies, many of which are increasingly focussed upon making the customer journey more ‘friction-free’. Consequently, it is important to understand not only the positive benefits of these business decisions but also the less desirable outcomes as well. I believe this report will certainly help those who have a responsibility for ensuring that their organisations continue to reap the benefits that self-scan technologies can bring to retailing while doing so within a sustainable business model.
I very much hope you enjoy reading this report and utilising its findings to better understand how self-scan and self-pay systems might be impacting upon your retail losses, but also how you can develop practicable ways to effectively manage these technologies in your particular environment. Finally, I would like to thank all those companies that agreed to support this study – your contribution to helping the broader retail community better understand this important issue is very much appreciated
John Fonteijn
Chair of the ECR Community Shrinkage and On-shelf Availability Group
Executive Summary
Background
This report is focussed upon quantifying the risks associated with three forms of self-scan and checkout technology (SCO): Fixed (the consumer scans at a designated machine) Scan and Go (the consumer is provided with a scan gun by the retailer) and Mobile Scan and Go (the consumer users their own mobile device to scan items) (1) . In addition, it provides a critical review of the various ways in which these risks might be controlled and managed.
It is based upon data collected from 13 retail companies and two SCO technology providers. Interviews were carried out with 73 key stakeholders from these companies and 11 store visits were conducted to review the technologies in use. In addition, a range of data points were collected from participating retailers, including: 140 million Scan and Go transactions; 17 million transaction audits; 486,000 items found not to have been scanned; video analytics of €72 billion of Fixed SCO transactions; and comparative shrinkage (2) data from thousands of retail stores. It is the most comprehensive study to date on the scale and extent of losses associated with SCO technologies.
Impact of SCO on Retail Losses: Fixed SCO
Data comparing stores with and without Fixed SCO found that levels of loss were higher in the former than the latter, with some Grocery case studies recording losses in the region of 33% to 147% higher. One case study, focused on the difference between stores using SCO with and without a weight checking system, found that losses where there was no weight system were 147% higher than stores not using any SCO technology.
Utilisation data (number of transactions processed through SCO) showed that stores with higher rates had higher levels of shrinkage. Stores where 55-60% of transactions went through Fixed SCO can expect their shrinkage losses to be 31% higher. Similarly, data looking at rates of loss and the number of SCO machines in use found that stores with higher numbers of machine also had higher rates of loss. Stores with the average number of SCO machines (for the case-study retailer), could also expect to see shrinkage losses 31% higher than an estimated industry average (3) , while those utilising an above average number of machines could expect the rate of loss to be at least 60% higher or more.
Technology monitoring and video analysis data looking at €72 billion of transactions found that non-scanning at Fixed SCO machines accounted for 0.44% of SCO sales, amounting to 9.5% of all store-recorded shrinkage. The data suggested that non-scanning behaviours alone (not including mis-scanning, walk-aways etc) are likely to add 0.5 Basis points of loss per 1% of Fixed SCO utilisation.
Together the various data sets strongly indicate that previous assumptions that Fixed SCO do not generate additional losses for retailers are incorrect – the losses are real and, in some cases, significant. Based upon the available evidence it is estimated that for each 1% of Fixed SCO utilisation, a retail store should expect their shrinkage losses to increase by at least 1 Basis point. This estimate does not consider other forms of loss that SCO systems are likely to be generating, such as lost margin and lost profits due to out of stocks caused by increased errors in stock inventory records. At this time, it is not possible to put a concrete figure on these losses.
Given this, for a store with 50% of transactions being processed through Fixed SCO, it can expect its shrinkage losses to be 75% higher than the average rate found in Grocery retailing. None of this data takes into account the likely productivity savings retailers can accrue from using this technology nor any possible reductions in loss as a consequence of employing fewer staff.
Impact of SCO on Retail Losses: Scan and Go SCO
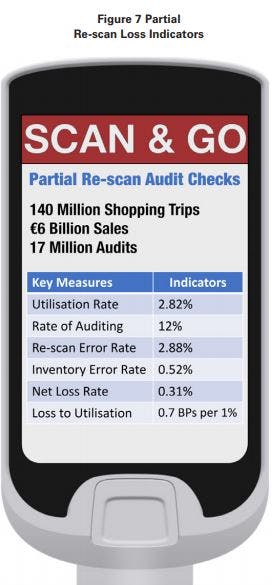
Analysis of 140 million transactions, found that the average utilisation rate of this technology was still relatively low – 2.82% of all transactions. Of this total, 12% or 17 million were subject to a Partial Re-scan Audit (only a small proportion of items are checked). Of those, 2.88% were found to contain at least one error, generating an overall inventory error rate of 0.52% of Scan and Go sales. When over-scans were taken into account, the net loss was calculated as 0.31% of Scan and Go SCO Sales, equivalent to a 0.7 Basis point increase in losses for every 1% of utilisation.
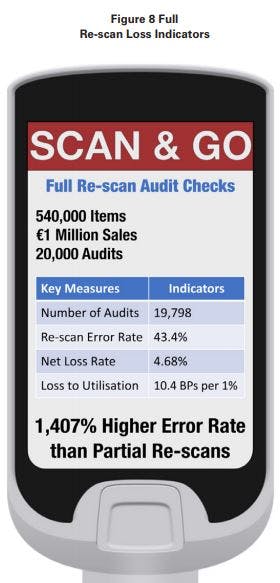
However, analysis of 20,000 random Full Re-scan Audits (every item is checked) provided by one case-study company paints a very different picture. It showed an overall error rate of 43.4% – 1,407% higher than the Partial Re-scan Audit data. When this error rate is used to calculate net losses, it shows that the rate is as much as 4.68% of all Scan and Go SCO sales, generating a Loss to Utilisation Ratio of 10.4 Basis points per 1%. Taken together, stores using this technology (at the utilisation rate found in this study) could see overall losses in the region of 0.96% of sales – a 43% increase.
Further analysis of Full Re-scan Audit data, using probability statistics, showed that as the size of shoppers’ baskets increased then the likelihood of an error occurring also increased. When a shopper has 50 items in their basket, then there is a 60% chance they will make at least one error, while for those with 100 items there is almost a 9 in 10 chance they will make an error.
One retailer shared data comparing stores with and without Scan and Go SCO, which showed that those with the technology had a rate of shrinkage 18% higher than those that did not, suggesting a Utilisation to Loss Ratio of 5 Basis points for each 1% of utilisation.
Controlling SCO: Keeping Shoppers Honest and Accurate
Controlling Fixed SCO
Guardianship: this was considered to be the most important factor by respondents but also difficult to ensure compliance at store level. The key was ensuring suitable, properly trained and motivated Supervisors were used and that they were operating in an environment which facilitated rather than hindered their duties. Overall, respondents to this research thought the optimal Supervisor to SCO machine ratio was 5-6 although this could flex depending upon the SCO environment in place.
Technology: Scan Verification Technologies were most prevalent – weight-based checking and video analysis of customer scanning behaviours. The former was the most established although opinions varied on its applicability with some deciding to turn it off because of its impact on the customer experience. Others had taken the decision to adapt and refine it to better fit their retail context and achieve an acceptable balance between risk amplification and minimising customer friction. Given the challenges of controlling Fixed SCO systems, the latter approach would seem a good option to adopt.
Product Verification Technologies were not used at all in the case-study companies although some were beginning to trial them. Designed to help mitigate against mis-scanning errors and help speed up the checkout process, these technologies could make a real contribution to managing SCO losses and improving the customer experience, but as yet further work is required to make them a viable prospect.
Design: developing effective ways to amplify risk and enhance detection in the SCO environment – creating Zones of Control – is important. Key was the location of the SCO area within the store, how customers were channelled through this space, the location and sight lines of the SCO supervisor, and the use of risk amplifiers such as CCTV and signage.
Controlling Scan and Go/Mobile SCO
In comparison with Fixed SCO systems, Scan and Go/Mobile SCO currently offers far fewer opportunities to amplify risk and enhance detection – the majority of current controls are focussed upon six process-based factors.
Robust User Identification: ensuring that retailers had a clear verifiable way of understanding who was registering to use their systems.
Establishing User Expectations: retailers should only be offering this facility to those who clearly understood the ‘rules of the game’ – that it is a privilege and not a right to access this way of shopping and that it comes with clearly defined expectations on the part of the retailer, including that on the first use a shopper will be audited.
Delivering Credible Audits: delivering deterrence and detection of errant users through the use of consumer behaviour-driven algorithms and utilising capable guardians. The latter need to be supported with data-driven tools to ensure they are equipped to identify items most likely to have not been scanned.
Utilising Fixed Payment Points: While current Mobile Scan and Go SCO systems require the user to go to a fixed point to confirm payment, concerns that developing iterations of Mobile Scan and Go SCO will allow the user to pay on their mobile device at any location were raised. This was considered extremely risky as it removes a key control point within the SCO shopping journey.
Communicating with Users: A number of respondents described ways in which they were considering the communication of risk-related messages to users, particularly with Mobile Scan and Go SCO through the associated App.
Exit Control Strategies: Some retail companies already use or are thinking about introducing designated exit areas where Mobile Scan and Go SCO users must go to leave the store. These often require the user to scan a code generated upon payment that opens the exit gate.
Minimising Product-driven Errors
Packaging and Barcode Issues: respondents flagged up a range of issues relating to barcodes on some products that made them difficult to scan; others were concerned about the use of multiple barcodes on the same product. Retailers should consider meeting with suppliers to review product design issues that may be contributing to SCO-related problems.
Set-up Issues: a number of case-study companies recognised that errors within their own organisations were creating problems, particularly relating to the regular updating of product inventory systems, especially when items were sourced locally.
Product Protection Issues: ensuring that not only tagged items were consistently de-tagged but also that Scan and Go/Mobile SCO users were reliably informed about which items needed to be de-tagged was considered a real concern by respondents.
Controlling the SCO Environment Dynamically
Just as risk is not evenly distributed across the retail landscape, the use of strategies to manage SCO systems should also be tailored to the circumstances in which it is being used. Different operating environments may well not only require a different palette of interventions but also variable tolerance settings depending upon the circumstances.
Compliance is Key
Store teams need to be clearly guided on why agreed practices and policies relating to the control of SCO systems need to be rigorously and consistently enforced, such as the maximum number of Fixed SCO units per supervisor. The provision of unambiguous data on the impact SCO-related losses are having on the business will be a key first step in achieving this goal.
Conclusions
The extent of the losses presented in this report suggest that retail businesses, and their partners, need to rebalance their assessments of the benefits that can accrue from investing in SCO-related technologies – the ROI calculation needs to fully take account of what the negative impacts might be.
Developing a Framework to Manage SCO in Retailing
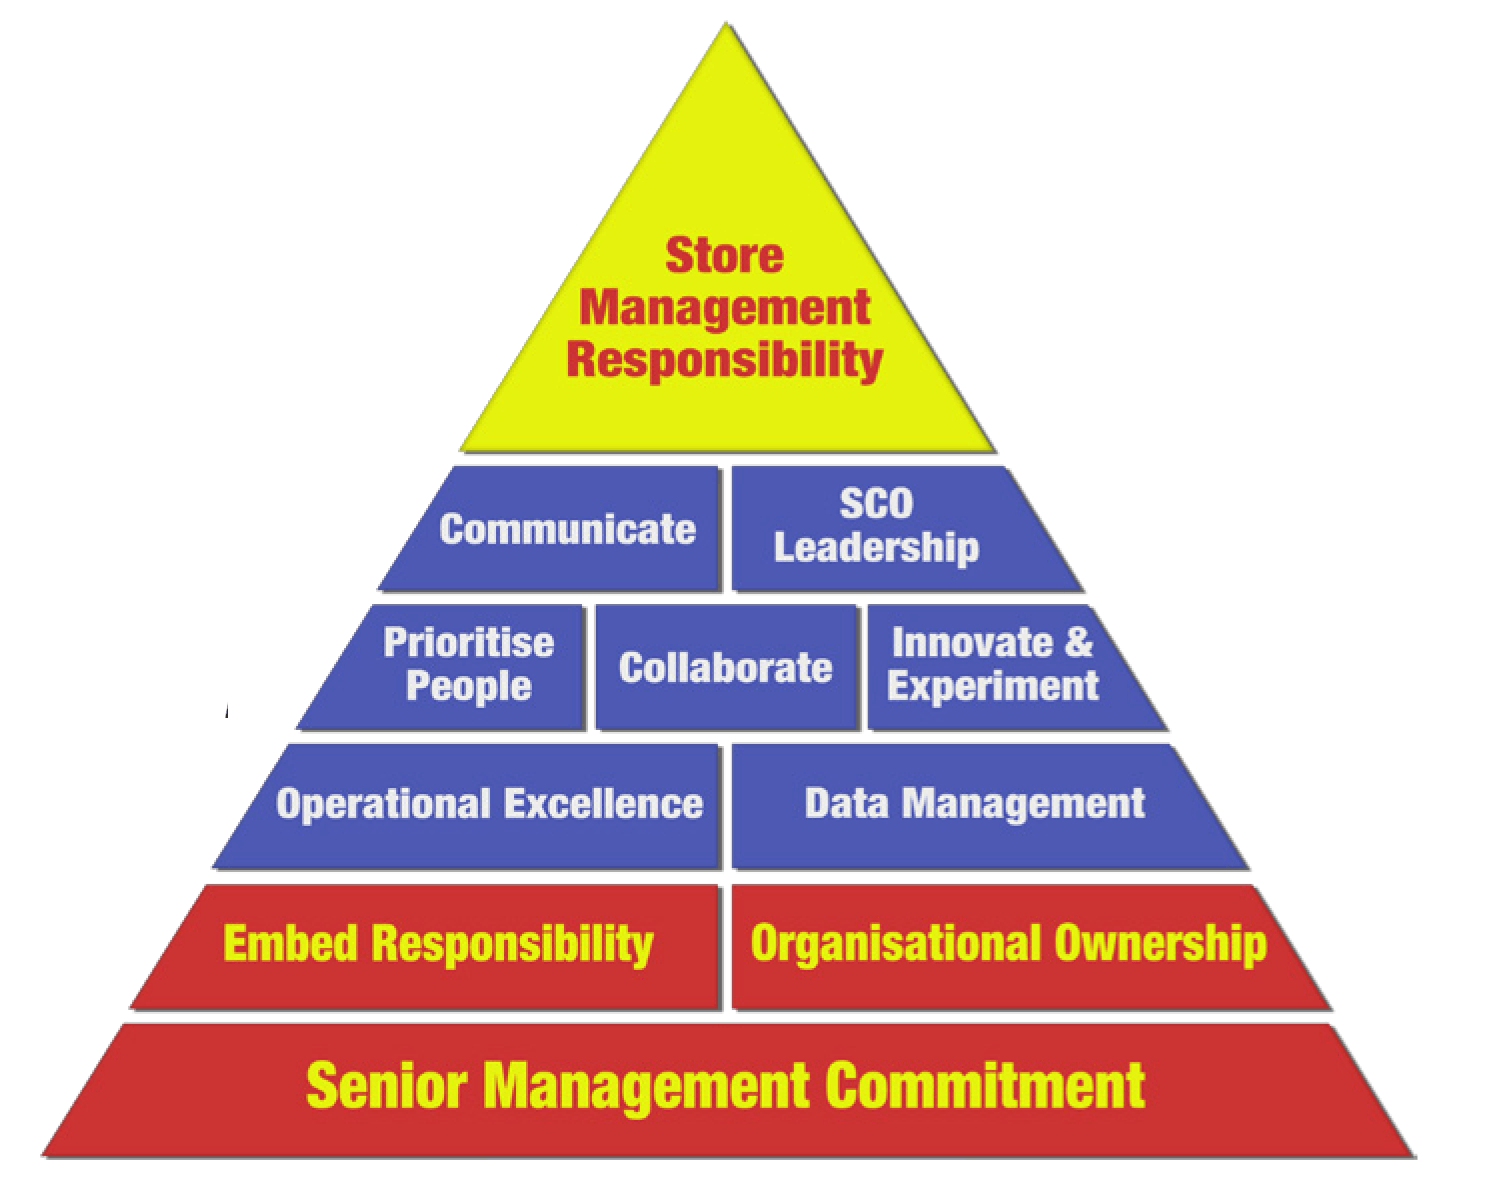
Using a variant of an existing loss prevention model, the research developed a framework for how retail businesses can go about developing an organisation-wide approach to managing the risk associated with use of SCO systems, focussing upon 11 key themes:
- ensuring there is senior management commitment focussed on understanding all the outcomes of investing in SCO;
- developing cross-functional organisational ownership and embedded responsibility for the control of SCO;
- establishing a clear set of data management protocols to fully understand the impact of various types of SCO technologies on the business;
- prioritising operational excellence in how SCO is developed and managed;
- committing to a programme of innovation and experimentation to improve control;
- forging better collaboration between different retail functions and with SCO technology providers to not only understand the risk side of the SCO equation, but also develop and evaluate interventions that may help mitigate the identified risks;
- recognising and prioritising the role people can play in actively managing and controlling SCO systems;
- striving to develop SCO leadership that can articulate all aspects of its use within retailing, including not only the possible benefits but also the possible risks;
- ensuring that there is communication with all parts of the business on all aspects of SCO; and
- delivering store management responsibility by providing them with data to understand the challenges, the training, resources and technological tools to create an environment that minimises risk, and incentivisation to ensure that they remain compliant.
Taken together, these factors offer an approach to begin to develop a more coherent and coordinated strategy to begin to better manage the risks associated with SCO systems in retailing, one that continues to recognise the benefits, but also takes more account of the growing challenges that they now seem to be presenting.
Introduction
The use of self-scan and checkout (SCO) technologies has grown considerably in the past 15 years, predominately, but not exclusively in the Grocery sector, where customer and product volumes, and space utilisation issues, make it a particularly appealing proposition (4) . For many retailers it has provided a significant opportunity to reduce their core costs at a time of increasing competition, and as new iterations of the technology have evolved, there would seem to be a growing appetite amongst certain groups of users to prefer this mode of shopping (5) .
A fundamental component of the SCO proposition is the transfer of responsibility for the accurate scanning of products and ensuring correct payment is made from staff employed by the retailer to the consumer. Since the very early days of retailing incidents of customers stealing product have been recorded and indeed a whole industry has been established trying to manage this problem as incremental changes in the retail environment have increased the risk of losses occurring (6) . For many of those tasked with ensuring that retailers sell more products than they lose, the emergence of SCO technologies has been viewed as a concern, not least in the difficulty in imposing strong enough controls over the way in which it may be used and abused (7) .
It is within this context that the current research was formulated. It set out to deliver two key objectives: quantify the risks associated with different forms of SCO technology; and review the various ways in which these risks might be controlled and managed.
The research is based upon data collected from 13 major retail users of SCO technologies, with a combined turnover of €586 billion. It makes use of both qualitative data – interviews with 73 key stakeholders in 13 retail companies and two SCO technology providers – and various types of quantitative data – over 140 million Scan and Go SCO transactions; 17 million audit checks, video analysis of €72 billion of Fixed SCO transactions together with the review of 486,000 items found not to be scanned. In addition, rates of loss between thousands of stores using and not using various SCO systems was analysed (further details about the methodology can be found in Appendix I).
This report is broken down into a further five Sections. The next looks at the background and context to the development and use of SCO systems in retailing. Section three moves on to consider how SCO-related losses impact upon retail profitability and the challenges retailers face trying to accurately measure them, while Section four presents the available data on the actual impact SCO technologies may be having, looking first at Fixed SCO before moving on to concentrate on the data available on Scan and Go SCO. Section five moves on to provide a review of the various ways in which SCO technologies might be controlled and managed, while the final Section brings together the key conclusions that can be drawn from this study.

Background
The Rise of SCO Technologies
While opinions vary on who was the original inventor of the first retail self-scan machine, most agree that they began to be tested and used in the late 1980s/early 1990s. From this point in time, the pace of adoption has gradually increased although not to the same degree across all geographic retail markets, with the US and some countries in Europe becoming areas of particular use while less mature retail markets such as Africa and parts of Asia have seen more limited utilisation thus far. Within the last five years the pace of adoption in certain countries has been extremely rapid, with a number of retailers now offering self-scan only stores, while for many others, Fixed SCO in particular, is now a fundamental part of their business proposition (8) .
Types of Systems and Approaches in Use
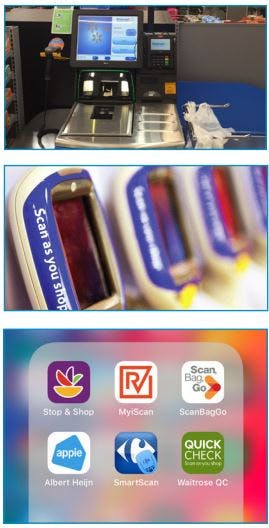
While there are numerous forms of SCO technologies available in the market place, there are three main types in use at the moment and they are the primary focus of this report.
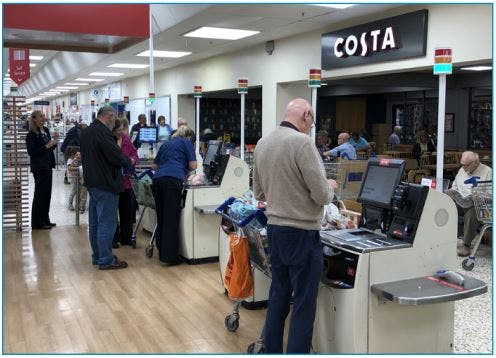
Fixed self-scan machines. This is where the consumer brings their chosen products to a fixed point in the store and proceeds to scan them either using the barcodes present on the items or by choosing the item type from a list of possible options provided by the machine displayed on an interactive screen. The consumer can then pay for their items either with cash or by some form of payment card. Throughout this report they will be referred to as Fixed SCO systems or technologies.
Scan and Go Systems. This is where the consumer is provided with a ‘scan gun’ by the retailer which can be used while shopping to scan the barcodes of items they wish to purchase. At the end of the shopping journey, the user is then required to go to a fixed point and dock their scan gun in a terminal, which then processes the transaction and takes payment from the consumer. Throughout this report they will be referred to as Scan and Go SCO systems or technologies.
Mobile Scan and Go Systems. The third main variant in use now, and one that has only recently begun to be offered by retailers, is similar to the Scan and Go system described above except that instead of using a scan gun provided by the retailer, the consumer uses their own mobile device, utilising a bespoke App provided by the retailer (or a third party), and the camera functionality built into the device, to scan and record products they wish to purchase. This also provides the option for the consumer to pay for their items anywhere in the store via their mobile device. Throughout this report they will be referred to as Mobile Scan and Go SCO systems or technologies (9) .
Other forms of SCO technologies are available, with new approaches being developed all the time, including the use of RFID (10). More recently the Amazon Go system, which was unveiled towards the end of 2016, uses a network of cameras, sensors and weight pads to enable a consumer to pick up any items and exit the store without any need for barcode scanning or interaction with a payment system (11). The prospective consumer needs to be registered with Amazon and to have downloaded a bespoke App before entering the store. Upon arrival, the user has to scan a unique code generated by the App on their mobile device to gain access to the store, and then they are free to select items and then simply leave the store, receiving an electronic receipt within 20 minutes.
Utilisation of SCO and Risk
From the very outset of the use of SCO systems retailers have recognised that they might increase their exposure to retail losses by generating a range of new opportunities for loss to occur, both malicious and non malicious, and for these opportunities to be encountered by a larger proportion of the shopping community than seen previously. Previous research has shown how opportunity can play a key role in the decision-making of would-be offenders . It suggests there are four key factors that are typically considered: the perceived risk (how likely is it that I will be caught?); the relative ease with which the offence can be committed (how easy is it for me to do this?); the benefit of undertaking the offence (what will I get from doing this and is it worth it?); and the likely consequences if they were to be caught (what will happen to me if they catch me?). If a wouldbe offender decides that the risk is low, that it is easy to do, well worth the effort and even if they were to be caught the consequences would be low, then they are highly likely to go ahead and offend.
For retailers trying to control shop theft, generating perceived risk and reducing the ease of offending have been key factors to focus upon (the other two have traditionally been beyond their spheres of influence or desire to impact upon ). Certainly, when it comes to more opportunistic thieves, if the perceived risk can be elevated and the ease of offending reduced, then they are much less likely to be tempted to move along the crime continuum.
What seems evident is that the emerging SCO environments being introduced by retailers around the world are potentially making it much more challenging to impact upon these key decision-making factors. The reality could be that SCO abusers feel it is a low risk endeavour, which is easy to do, reaps rich rewards, and even if they are caught, leads to little or no sanctions being applied. Given that, it may not be surprising that more and more shoppers may be tempted to take advantage of the opportunities presented to them by SCO systems.
Competing Expectations: The Role of Loss Prevention
While many loss prevention functions in retail businesses are familiar with, and used to, being labelled the ‘sales prevention’ team by their colleagues occupying more customer facing roles, the reality is that most retail businesses are now beginning to recognise the need to understand the often-delicate balance between sales and losses – that seemingly positive sales can easily be undone by high levels of loss accrued across the business. As a number of respondents put it: ‘we have been swept up with the mood of do whatever we can to reduce customer friction; [we] haven’t done enough to understand the impact on leakage [retail losses] results’[R5]; ‘consideration of risk has been secondary in our thinking to be honest – improving capacity has been more important’[R10]. As detailed in the next section, a lack of data across all the participating retailers in this study on the impact various SCO systems might have on retail profitability had frequently led to often fraught relationships between those tasked with utilising SCO to reduce labour costs and consumer friction and those employed to manage retail risk. For the former, this lack of reliable risk-related data had often been seen as a green light to continue implementing yet further friction-reducing strategies, while for the latter, this apparently ‘cavalier’ approach to managing risk was generating a growing sense of panic and concern about accountability and control.
Understanding SCO-related Losses
Key Drivers of Lost Profits
Detailed below are the various ways in which respondents to this research described how they thought their SCO systems were generating losses (Figure 1). They identified three main forms of loss: the direct loss of stock, the direct loss of margin, and the indirect loss of sales driven by out of stocks which in turn are caused by the generation of stock inaccuracies.
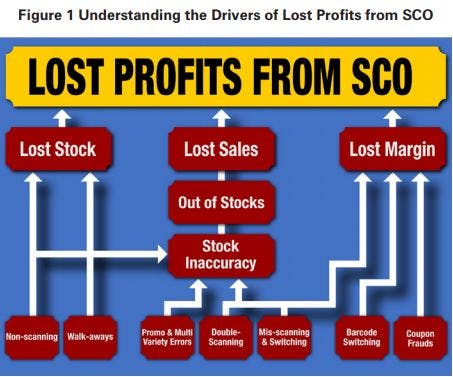
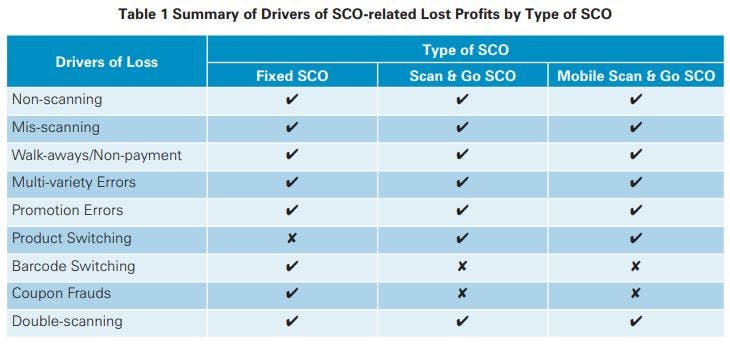
Across the three variants of SCO, the following methods were most frequently cited (summarised in Table 1):
Non-scanning: this can happen in a number of ways including, passing the item across the Fixed SCO scan area ensuring the barcode cannot be read and placing it in the bagging area (when weight-based security systems are not present or are set to tolerate one or more items not being scanned), or placing it directly into a bag next to the bagging area.
Walk-aways/Non-payment: this form of loss occurs at Fixed SCO machines when a user has scanned some or all of their items correctly and triggers the completion of the transaction but does not make payment, simply walking away with the items.
Promotion Errors: similar to the previous scan error, this does not necessarily generate an immediate financial loss for the retailer but does corrupt inventory records. In this situation the promotion is a buy-one-get-one free offer where the user only scans one item because they assume the second one is free and therefore does not need scanning.
Multiple Variety Errors: this form of error corrupts store inventory records, which over time could lead to out of stocks and an eventual loss in sales. In this situation, the user has selected a product which is available in a number of varieties or flavours, such as a tins of cat food – chicken, beef, fish etc. The consumer simply scans the same variety several times to speed up the process and places them in the bagging area.
Double-scanning: This type of error is in many respects a double-edged sword for retailers. On the one hand, when a consumer accidentally scans the same item once or more, then they will be paid for the same product more than once, generating a significant profit. On the other hand, the same behaviour will also adversely impact on stock accuracy – store systems will potentially over order double-scanned items, which could lead to a range of adverse outcomes.
Mis-scanning: there are two main ways in which this typically happens. In the first, the user places a particular item on the weigh scale, such as a kilo of grapes and then chooses a cheaper item from the list of options available, such as carrots or potatoes. The second form is the mis-representation of items of a similar weight but differing values.
Product switching: a variant of mis-scanning is also possible with Scan and Go. In this scenario the user scans a particular variant of a product but then places it back on the shelf and replaces it with a more expensive type.
Barcode Switching: this form of loss occurs where a user obtains a different (usually cheaper priced) barcode for a product and scans the barcode as the product is moved across the Fixed SCO scan area.
Coupon Frauds: In this scenario the use of promotional coupons is abused by the user, typically by using the same coupon multiple times, leading to lost margin.
Challenges of Measuring SCO Losses
One of the key findings of this research has been the degree of difficulty obtaining reliable, robust and verifiable data on the losses associated with various types of SCO systems used by retailers. In part this is a function of the type of data that needs to be collected, but it is also, in some respects, indicative of the business culture within which SCO systems have evolved.
Retailers calculate their stock loss, typically called ‘shrinkage’ or ‘shrink’, through measuring the difference between the amount of stock they think they should have (the remainder between actual goods purchased minus those sold) and what they actually have, usually ascertained through regular physical audits/stock counts. The difference is their ‘shrinkage’ number, which is often, but not exclusively, calculated as a percentage of sales.
The difficulty lies in trying to understand the cause of any missing stock, particularly when stock audits are carried out infrequently (often annually). The time lag between a loss event happening and it eventually being recorded can be considerable, making identification of the cause extremely challenging. Within the context of SCO, this inability to easily and accurately measure what the true causes of shrinkage are makes it difficult to understand what proportion of loss it may be accountable for – in effect, how much of the shrinkage pie is a direct consequence of its introduction and use?
However, it is not impossible and data collection methods can and have been developed to try and achieve a much clearer understanding of the likely losses associated with various types of SCO system. But, in order for this to happen, clear data collection protocols need to be put in place to ensure that any SCO-related losses are accurately captured. It seems clear from this study that many of the contributing companies had either failed to put them in place and/or had not enabled the process of collation and analysis to be routinised, made transparent and perhaps most importantly, viewed by others in the organisation as grounded in robust and reliable methods:
as a shrinkage team we were not sophisticated enough to measure it and appreciate the impact of changes. For years everybody knew there was cost associated with SCO but because no one had truly measured it, it was one of those numbers that the Operations Team could dismiss or refute[R2].
The problem of measuring SCO-related losses not only impacts upon the ability to understand the scale of the problem, but it also impacts upon the capacity to measure the effect of any interventions introduced to try and minimise these losses.
So, while the challenges of measuring SCO-related losses are real and apparent, it is also evident across some of the case-study companies that an organisational mindset had been established that viewed SCO technologies through what might be regarded as rose-tinted glasses: ‘senior management have been naive in the execution of SCO, we haven’t done enough benchmarking to understand the impact long term’[R5].
Certainly for some, it was felt that the challenges of measuring the risk provided some in the business with an opportunity to side line this issue in favour of rapidly rolling out this technology: ‘been a little bit frustrating working with the development team – they won’t believe data which might show that losses have gone up and are inclined to blame other factors for the change’[R12]; ‘there was no conversation about risk when the technology was first brought in; it was a technology that grew so fast in terms of nobody was really able to measure it’[R2].
Indeed, one respondent was clear that if that investment had been made at the very beginning of their SCO journey, then it may have been a very different picture: ‘if the business had had the data back then, it may have been a very different approach to the roll out’[R1]. Perhaps more positively, there were clear signs in some of the companies taking part in this study that attitudes were beginning to change, with a growing realisation that there were negative outcomes associated with SCO technologies and that these now needed to be measured more accurately and consistently.
"senior management have been naive in the execution of SCO, we haven’t done enough benchmarking to understand the impact long term"
"if the business had had the data back then, it may have been a very different approach to the roll out"
Impact of SCO on Retail Losses
Losses Associated with Fixed SCO Systems
With and Without Comparisons
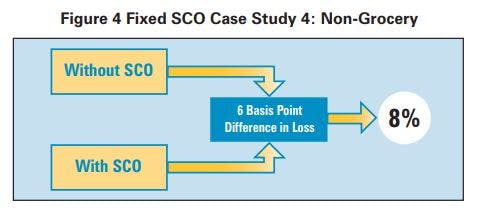
Detailed below in Figures 2 to 4 are the four Before and After Case Studies, detailing the differing rates of loss (measured as their rate of shrinkage as a percentage of overall sales) between stores with and without Fixed SCO systems. Where it was made available, the number of stores upon which the data is based is also provided, as is the timeframe over which the data was collected. All of this data needs to be treated with some caution – it was not possible to accurately ascertain whether the different store groups were adequately matched to ensure that other confounding factors may better explain the differing rates of loss found. Neither was it possible to differentiate between the approaches being adopted to manage and control the Fixed SCO systems. In this respect, the data presented below can really only be used to provide an indicator of the likelihood of Fixed SCO systems to generate additional loss – it would be unwise to try and draw an overall average from these four case studies.
What can be seen is that in all four cases losses were higher in stores that were using SCO compared to those that were not. In the three Grocery case studies, the differences were considerable – between 33% and 147% higher. One of the Grocery case studies was able to provide a further breakdown of their losses between two types of Fixed SCO machine they were using – those with a weight-based checking functionality and those without. In this case, the losses for non-weight checking machines was much higher – 147% higher than stores with no Fixed SCO machines at all. For the stores with a weight-based system then the difference was calculated at being 52% higher than stores without any form of Fixed SCO. It does need to be noted, however, that the number of stores in which the non-weighted Fixed SCO machines were in operation, was relatively low – only 32 stores compared with 740 for weight-based Fixed SCO and over 1,800 with no SCO machines at all.
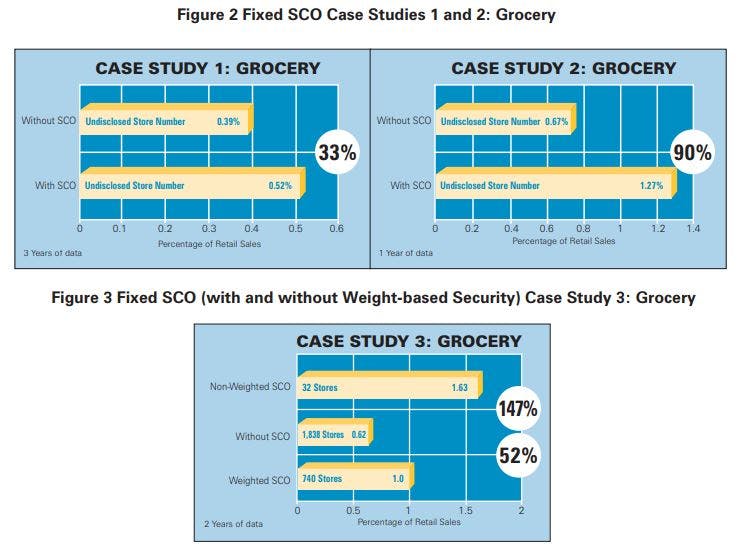
For the fourth case study, which was a non-grocery business, the difference while still higher in non-Fixed SCO stores, was much more modest at 8%. This company did, however, operate a significantly different Fixed SCO environment than found in most Grocery stores – a maximum of four machines per store, closely monitored by a SCO supervisor.
So, the main conclusion to be drawn from the data from these four case studies is that arguments suggesting that the introduction of Fixed SCO technologies make little or no difference to rates of retail loss are incorrect, particularly but not exclusively in Grocery retailing. It is also worth noting that this data is only measuring loss by using the declared shrinkage number – the other forms of loss associated with SCO outlined earlier – lost margin and lost profit from out of stocks – are not included in this analysis, which inevitably means they are an underestimate. However, it is also worth noting that none of this analysis considers the likely savings retailers may have accrued through the introduction of Fixed SCO technologies, in particular, labour costs, which will undoubtedly offset these increased losses, but to what extent is not known.
SCO Utilisation
Studies Another way to look at the possible impact of Fixed SCO technologies on levels of shrinkage is to analyse whether rates of loss are associated with the amount of transactions that are processed through them – do stores that have higher rates of SCO utilisation also have higher rates of loss? Only two retailers were able to share any data on this and in order to ensure their anonymity, the loss data has been transformed into an index score, where 100 represents the lowest utilisation rate provided. Detailed in Figure 5 is the results of this analysis, based upon data from just over 2,000 stores covering two years. As with the previous data it is important to note that it was not possible to carry out any detailed analysis to ensure that stores with differing rates of utilisation were comparable – it was not possible to run regression analysis to include other potentially confounding factors.
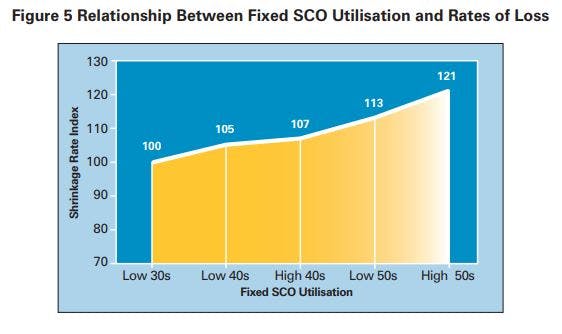
As can be seen, a clear trend emerges – those stores that have higher levels of Fixed SCO utilisation tend to have higher levels of loss. Compared with stores with utilisation rates (the total number of all transactions being processed through Fixed SCO) in the low 30% range, those in the low 40s typically had rates of loss that were 5 Basis points higher, and those that had utilisation rates in the high 40s were likely to see a 7 Basis point increase in their loss. Once utilisation rates went into the 50% range, then losses increased further – between 13 and 21 Basis points higher. If data from a recent ECR study is used, which suggested that average shrinkage losses in Grocery are in the region of 0.67% of sales, then a 21 Basis point increase would mean a 31% rise in their loss number when Fixed SCO systems account for between 55-60% of store transactions (15).
Another way to consider the impact of utilisation is to look at any possible differences in loss between stores with differing numbers of Fixed SCO machines in operation – do losses increase when the number of machines increase? Only one retailer was able to provide any reliable data on this issue, and again, to protect their identity, the data has been indexed. It is based upon information from over 2,500 stores covering one year (Figure 6).
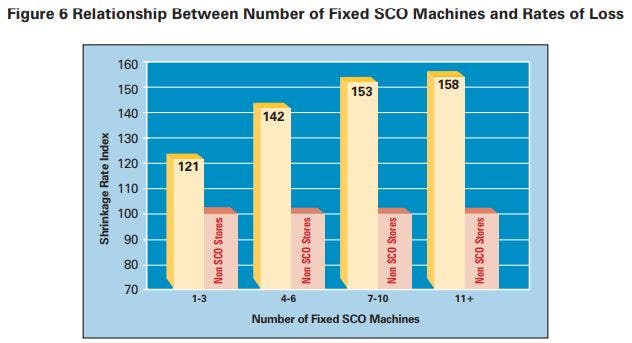
As with the previous utilisation data, the trend is very clear – as the number of machines increase, then the rate of loss also increases. When indexed against stores with no Fixed SCO machines in use, stores with between 1-3 machines had rates of loss 21 Basis points higher, and this grew considerably as the number of machines increased. For those stores operating between 7-10 machines, then they were experiencing a rate of loss 53 Basis points higher than stores with no Fixed SCO machines. This trend was largely consistent across the various store types that were combined to generate this data, although for some formats the number of stores with no Fixed SCO was low. If the ECR shrinkage average of 0.67% is used again together with the loss rate for the most common number of machines in use in this retailer (1-3), then the difference in loss is likely to be 31% higher. If the next highest SCO utilisation rate is used (4-6), then these stores are likely to experience a rate of shrinkage that is 62% higher than the ECR average.
Taken together, the two utilisation studies offer further data to show that Fixed SCO technologies do have an effect on retail store losses and that the more they are used, the higher the rate of loss that is likely to occur. When combined, the data indicates that for those companies heading towards 50% or more of their transactions being processed through an average of between 1-6 Fixed SCO machines per store, then they can expect their shrinkage losses to increase between 30%-60% compared with the ECR average.
Technology Monitoring and Video Review Analysis
Measuring Fixed SCO losses in any detail is not easy – as discussed earlier, trying to capture data points measuring the absence of something – in this case non-scanning by consumers – is at best problematic. There are, however, at least two possible approaches to try and address this problem. The first is to utilise one of a number of companies that now offer video-based analytical tools that, through linking with till EPOS systems, try to capture non-scanning events. The idea is that a combination of algorithms and human observers monitor customer movements around the till area and try to identify when products appear to move across this space without registering on the EPOS system. Initially used on staffed checkouts to capture incidents of non scanning and sweethearting (16), they are now being used by some retailers in their SCO environments as well.
The second possible approach to capture non-scanning activity at Fixed SCO machines is to carry out a video based audit whereby trained observers carefully watch a sample of SCO users over a period of time to try and identify non-scanning events. Like the previous system, they will also have a data feed from the EPOS system to help them carry out their analysis. Obviously, this is a less automated and far more labour-intensive methodology to adopt and so is rarely used beyond generating benchmark data.
This study has received data from one company that has been utilising the first option and data from another company that undertook a benchmarking exercise using the second option (they observed all SCO transactions in 20 stores for one week). In order to anonymise these companies, the results from the two approaches have been combined in a single data set. What this type of data can provide is an estimate of the value of items that would appear to have not been scanned – it is not possible with any confidence, however, to surmise the reason for the non-scanning – malicious or non-malicious.
Unfortunately, it is simply not possible to share any further explanatory data about the nature of the data, such as quantity of non-scans nor the number of stores involved because this would likely make identification of the companies possible. But, to give a sense of the scale of the data set, the combined SCO sales were €72 billion. It is also worth noting that both of these companies had taken the decision to turn off their weightbased security systems, mainly to reduce the number of alerts. Outlined in Table 2 are the key data points from this analysis – it has been weighted to take account of the relative size of the two companies.
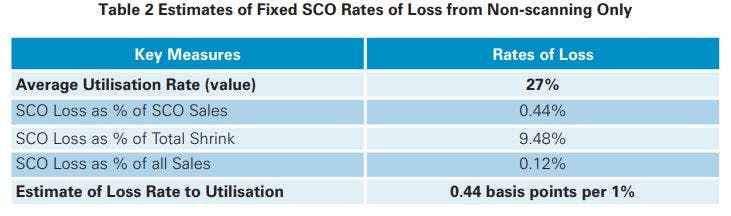
Measuring the impact of any SCO system is highly dependent upon taking into consideration the rate of utilisation – the number and/or value of transactions that are processed through a given form of checkout technology. This report, therefore takes this into account when calculating the likely impact of SCO systems on losses. It provides a loss rate to utilisation calculation based upon the actual value of losses provided by casestudy companies together with their declared rate of utilisation. This can then be used to calculate what each incremental increase in utilisation may generate in terms of additional losses – if a company has, say X% of their transactions through a given checkout system, then that is likely to generate Y amount of loss, measured in Basis points of loss. For the data above it was calculated that for every 1% of sales transaction value that is processed through Fixed SCO systems, there is likely to be a 0.44 Basis point increase in unknown loss from non-scanning.
However, there are a number of important caveats to make at this point. The data is only derived from casestudy companies where there was an absence of a weight-checking capability/deterrence. Both of these data sets were only focussed upon measuring the value of non-scanning events captured in the close vicinity of the Fixed SCO scanning area. The data does not record any other forms of SCO-related losses such as misscanning and walk-aways. Certainly, given concerns about the extent of the former in particular, then this data is likely to be an underestimate of the full extent of the losses generated by Fixed SCO systems.
Therefore, based upon the various available data sets on Fixed SCO, the evidence from the interviews and the researcher’s own reflections and experience, it would seem prudent to suggest that the actual loss for each 1% of Fixed SCO utilisation is more likely to be 1 Basis point of loss.
Estimating Losses Associated with Fixed SCO
As has been shown in this section, measuring Fixed SCO losses is possible, but not easy and all of the data sets collected as part of this research have methodological flaws undermining their efficacy. Given that, it is only possible to draw together some general conclusions and estimates about how much loss may be a consequence of Fixed SCO systems:
- Together the various data sets strongly indicate that previous assumptions that Fixed SCO technologies do not generate additional losses for retailers is incorrect – the losses are real and, in some cases, significant.
- Rates of loss appear to be linked with rates of utilisation – the more the technology is used, the higher the rate of loss that can be expected.
- Overall, stores where 50% or more of transactions are processed through Fixed SCO can expect their shrinkage number to increase by at least 30% and where this involves using more than 7-10 machines, it could be as high as 60%.
- Based upon the various available data sets, the evidence from the interviews and the researcher’s own reflections and experience, it would seem prudent to suggest that for each 1% of Fixed SCO utilisation, a retail store should expect their shrinkage losses to increase by 1 Basis point. This estimate does not consider other forms of loss that SCO systems are likely to be generating, such as lost margin and lost profits due to out of stocks caused by increased errors in stock inventory records. At this time, it is not possible to put a concrete figure on these losses. It also does not consider any reduction in losses that may have been achieved through reducing the number of staffed checkouts in the retail environment – no data is currently available to calculate this potential loss correction factor.
Losses Associated with Scan and Go SCO Systems
In contrast to Fixed SCO systems, Scan and Go SCO technologies do provide a number of opportunities to gather more routinely available and potentially very insightful data points relating to losses. For most companies using these systems, there is the capability to analyse data secured through the use of audits, which are carried out on users. These audits have been introduced to create some form of control over a system which, arguably, yet further stretches the retailer/customer trust continuum. Shoppers are (normally) informed that one of the conditions of using this system is that they may be subject to ‘random’ audits at any time to check whether they have been properly scanning all the items they wish to purchase.
These audits are undertaken at the end of the shopping journey, just prior to the payment process and are typically what are known as Partial Audit Checks – a member of staff is instructed by the system to check a small sample of items in a consumer’s basket/trolley to ensure that they have been scanned correctly. If an error is found, then they can either be subject to a full re-scan of all their items, and/or asked whether they want to add the items found to be un-scanned to their bill. The data from this auditing process, therefore, can give fascinating insights into the frequency with which shoppers are not scanning, and the types of items that are found not to have been scanned.
While Partial Re-scan data can be extremely useful, it is highly dependent upon the methodology developed to choose customers to be checked, and perhaps more importantly, the capability of the Audit Supervisor to find un-scanned items using a sampling method that can be influenced by a wide range of factors. For instance, the system may request that a Supervisor checks five items in a 100-item shopping journey – which items should they choose to check? Therefore, one retailer in this study has committed to carrying out full random audits of 1 in every 5,000 customers who use their Scan and Go SCO in order to generate a clearer picture of the extent to which errors may be being made by users. Detailed below are findings from both types of data.
In addition, one company has been able to provide some limited data on comparisons between rates of shrinkage in stores using Scan and Go and those that are not. Finally, one retailer was able to provide a list of all the items that they had found not to have been scanned as part of their auditing process. This list included product description, the total number of times that had not been scanned in a 12-month period and total value. Analysis of this data will also be presented below.
Partial Re-scan
Audit Data Five companies were able to share usable Partial Rescan Audit data. Between them they had processed a total of 140 million Scan and Go SCO shopping trips amounting to just over €6 billion in sales. Collectively, they had undertaken just over 17 million audit checks over a 12-month period. Detailed in Figure 7 is the summary data from these audits, which is weighted to take account of the relative size of each of the five companies.
Across the companies, the utilisation rate was relatively low – just 2.82% of all store transactions were accounted for by Scan and Go SCO. On average the companies were auditing roughly 1 in 8 users (12%) although this did vary between a low of 2% and a high of 17%. Of the audits undertaken just 2.88% were found to contain at least one error – which could be either an under-scan (the user had not scanned an item), or an over-scan (the user had scanned the same item twice or more). There was no data available on the incidence of mis-scans (grapes for carrots scams). Both types of error (under- and over-scan) have an impact on inventory accuracy although in terms of pure loss values, then over-scans can be used to offset the cost of under-scans.
What the data showed was that of the shopping journeys found to have an error of some kind, the sum of that error amounted to 0.52% of sales and that when the value of over-scans was taken into account, this generated a net loss rate of 0.31% all of sales. As with the Fixed SCO data, it was then possible to calculate what the likely increase in loss would be for each 1% of Scan and Go Utilisation, in this case 0.7 Basis points of shrinkage.
There are two important points to note, First, it is revealing to see the overall impact of shopper errors on inventory accuracy – equivalent to 0.52% of all Scan and Go sales, which will likely negatively impact upon on shelf availability and consequently lost sales. Secondly, the Utilisation to Loss ratio is, at face value, lower than that estimated for Fixed SCO systems. But, as mentioned earlier, the accuracy of Partial Re-scan data is open to debate because of the challenges of undertaking them accurately. It is therefore instructive to move on and consider what a sample of Full Re-scan data can reveal.
Full Re-scan Audit Data
Based upon a sample of nearly 20,000 full random audits (no algorithm- or Supervisor-driven selection) over a 12-month period, one Grocery case-study company was able to provide a set of data that offers powerful insights into what the actual losses associated with Scan and Go SCO might actually be (Figure 8).
As can be seen, the Full Re-scan error rate is profoundly different to that found with Partial Re-scans – 43.4% of all audits found an error compared with just 2.88% – 1,407% higher! This is an extraordinary statistic, which fundamentally questions the veracity of the Partial Re-scan process to accurately identify the true scale of losses associated with Scan and Go SCO. Using this data, it is possible to calculate that the net losses (taking account of over-scans) could amount to as much as 4.68% of retail sales through Scan and Go SCO.
Using this rate, it would suggest that for each one per percent of utilisation, retailers are likely to see a 10.4 Basis point increase in their losses. Moreover, at an average utilisation rate of 2.82% (see above), then it is possible that Scan and Go could be adding approximately 29 Basis point of loss to store shrinkage, which combined with the ECR average for Grocery losses (0.67%) would make overall losses in the region of 0.96% of sales – a 43% increase.
It was possible to do further analysis on the error rate found in the Full Re-scan data, looking particularly at the impact of the size of the basket on the likelihood for an error to be present (Figure 9).
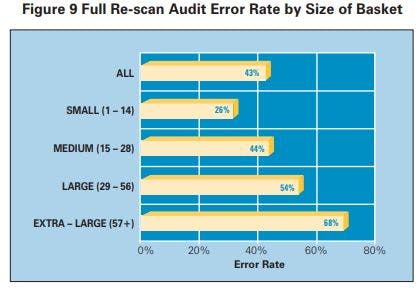
As the size of the basket increases, then the likelihood of error also increases. For baskets with less than 15 items, the error was one in four (25.6%), while for large baskets (up to 56 items) it rose to one in two (54.1%), and for customers with 57 or more items, then over two-thirds were found to contain at least one error (67.7%). Indeed, using this data together with probability theory, it is possible to calculate the likelihood of an error occurring for a given basket size, which is provided in Figure 10.
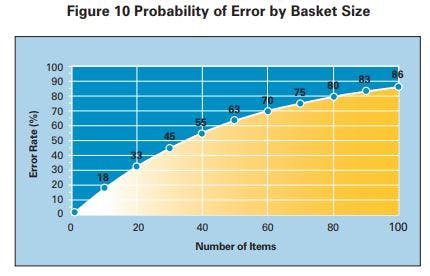
As can be seen, the likelihood of an error occurring becomes much more likely as the size of a basket increases. If a customer has 20 items in their basket, then there is a 30% chance that they will have made some sort of error. When the basket size begins to get much bigger, then the probability of at least one error being made becomes much more certain – with 100 items, then there is almost a 90% chance there will be a problem with at least one item. This is a serious concern for retailers offering this form of SCO – it is designed for shoppers who mainly want the convenience it provides when doing large shopping trips. The reality is that there is a very strong probability that with every one of these large shopping trips, it is almost guaranteed that at least one scanning error has occurred.
Rates of Under and Over Scanning
Audit data can also shed light on the extent to which customers are under versus over-scanning, although many Partial Re-scan operations are unlikely to easily capture the latter compared with the former (the Supervisor would need to complete a full re-scan to accurately identify when a user has scanned the same item twice or more). However, three companies were viewed as having sufficiently reliable data on rates of non and over scanning found as part of their auditing processes (Figure 11).
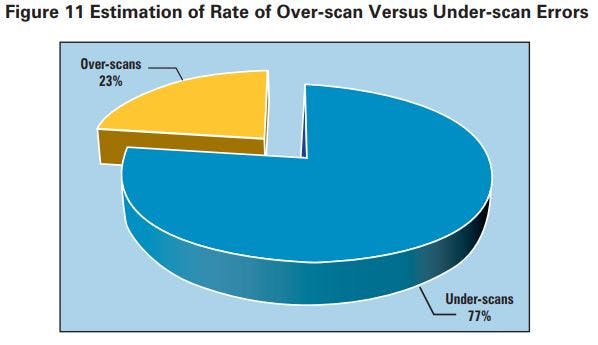
On average 77% of item errors were found to be due to non-scanning, with 23% being a result of over scanning on the part of the consumer. While there was some slight variation between the companies on the average value of an over-scanned versus non-scanned item, the difference was marginal. For the most part, user errors seem to generally tip in their favour!
With and Without Comparisons
Only one company had any shrinkage data comparing stores that were and were not using Scan and Go SCO systems, the results of which are detailed in Figure 12.
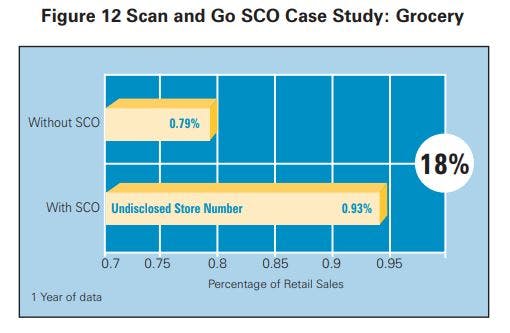
Caution needs to be employed when reviewing this data – the sample of stores is very low as is current rates of utilisation (less than 3% of transactions). However, given all of that, it is still interesting that they had found an 18% difference in rates of shrinkage between those stores that were using Scan and Go SCO and those that were not – a 14 Basis point difference in loss which would suggest a Loss to Utilisation Ratio of 5 Basis points (each 1% of utilisation equates to a 5 Basis point increase in loss). Once again, this data suggests that there are considerable risks associated with this technology.
Analysis of Non-scanned Items
The final set of data available on Scan and GO SCO relates to the types of items found not to have been scanned when Audits are undertaken. One of the companies was prepared to share a detailed list of all the items that they had found – over a one-year period this amounted to over 52,000 separate SKUs, adding up to 486,000 items with a total value of just over €1.2 million (note, the data was provided by a UK Grocer).
Detailed in Table 2 are the top 20 items that were most frequently found to have not been scanned (by quantity). Across all 52,000 SKUs, the most frequently non-scanned item was various types of reusable carrier bag, accounting for 1.5% of items not scanned. This was followed by loose bananas, semi-skimmed milk and then a range of fruits and vegetables. Collectively, the top 20 items accounted for only 6% of all the items found not to have been scanned, indicating the breadth of items that end up not being scanned by SCO users. Of the top 20 non-scanned items, 85% were either fruit/vegetables or dairy products. It is difficult to offer much further interpretation of this data in this format beyond commenting on the frequency of non-scanning of re-usable bags – they are potentially a product with ‘ambiguous’ ownership – consumers may feel that they are free as part of their shopping journey, or perhaps more likely, that they should be free given that they are scanning all the items they wish to purchase.
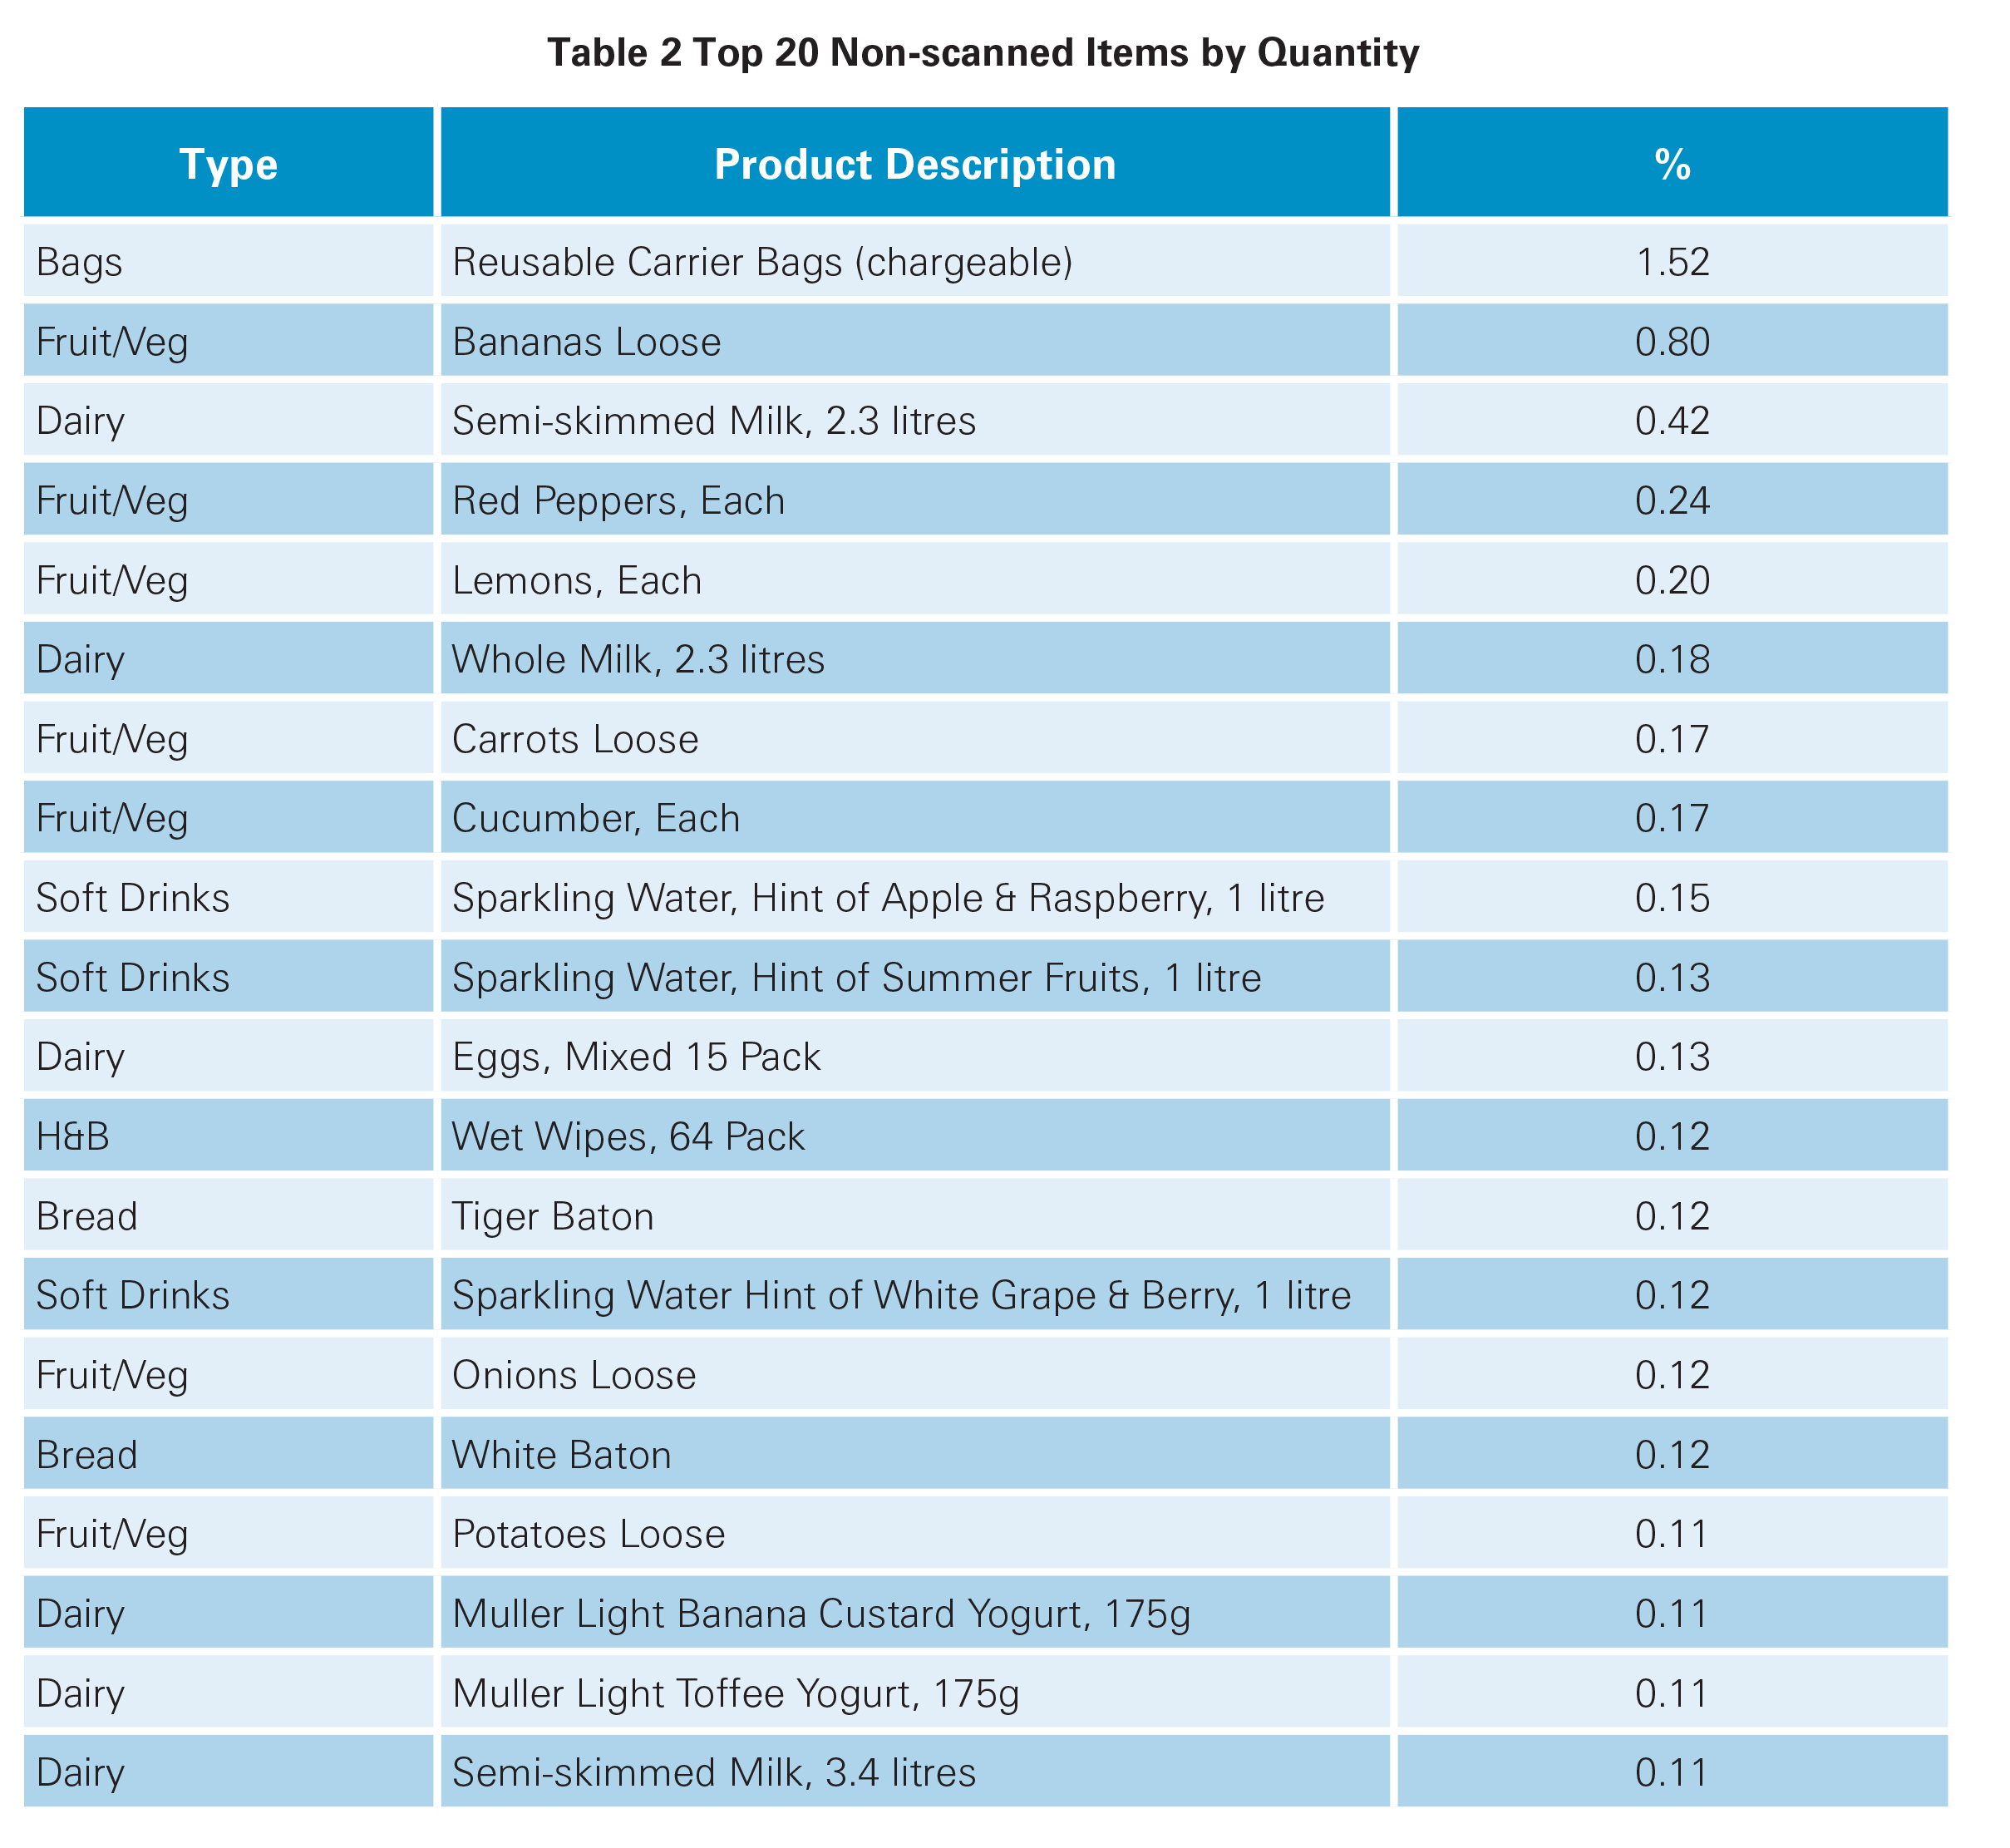
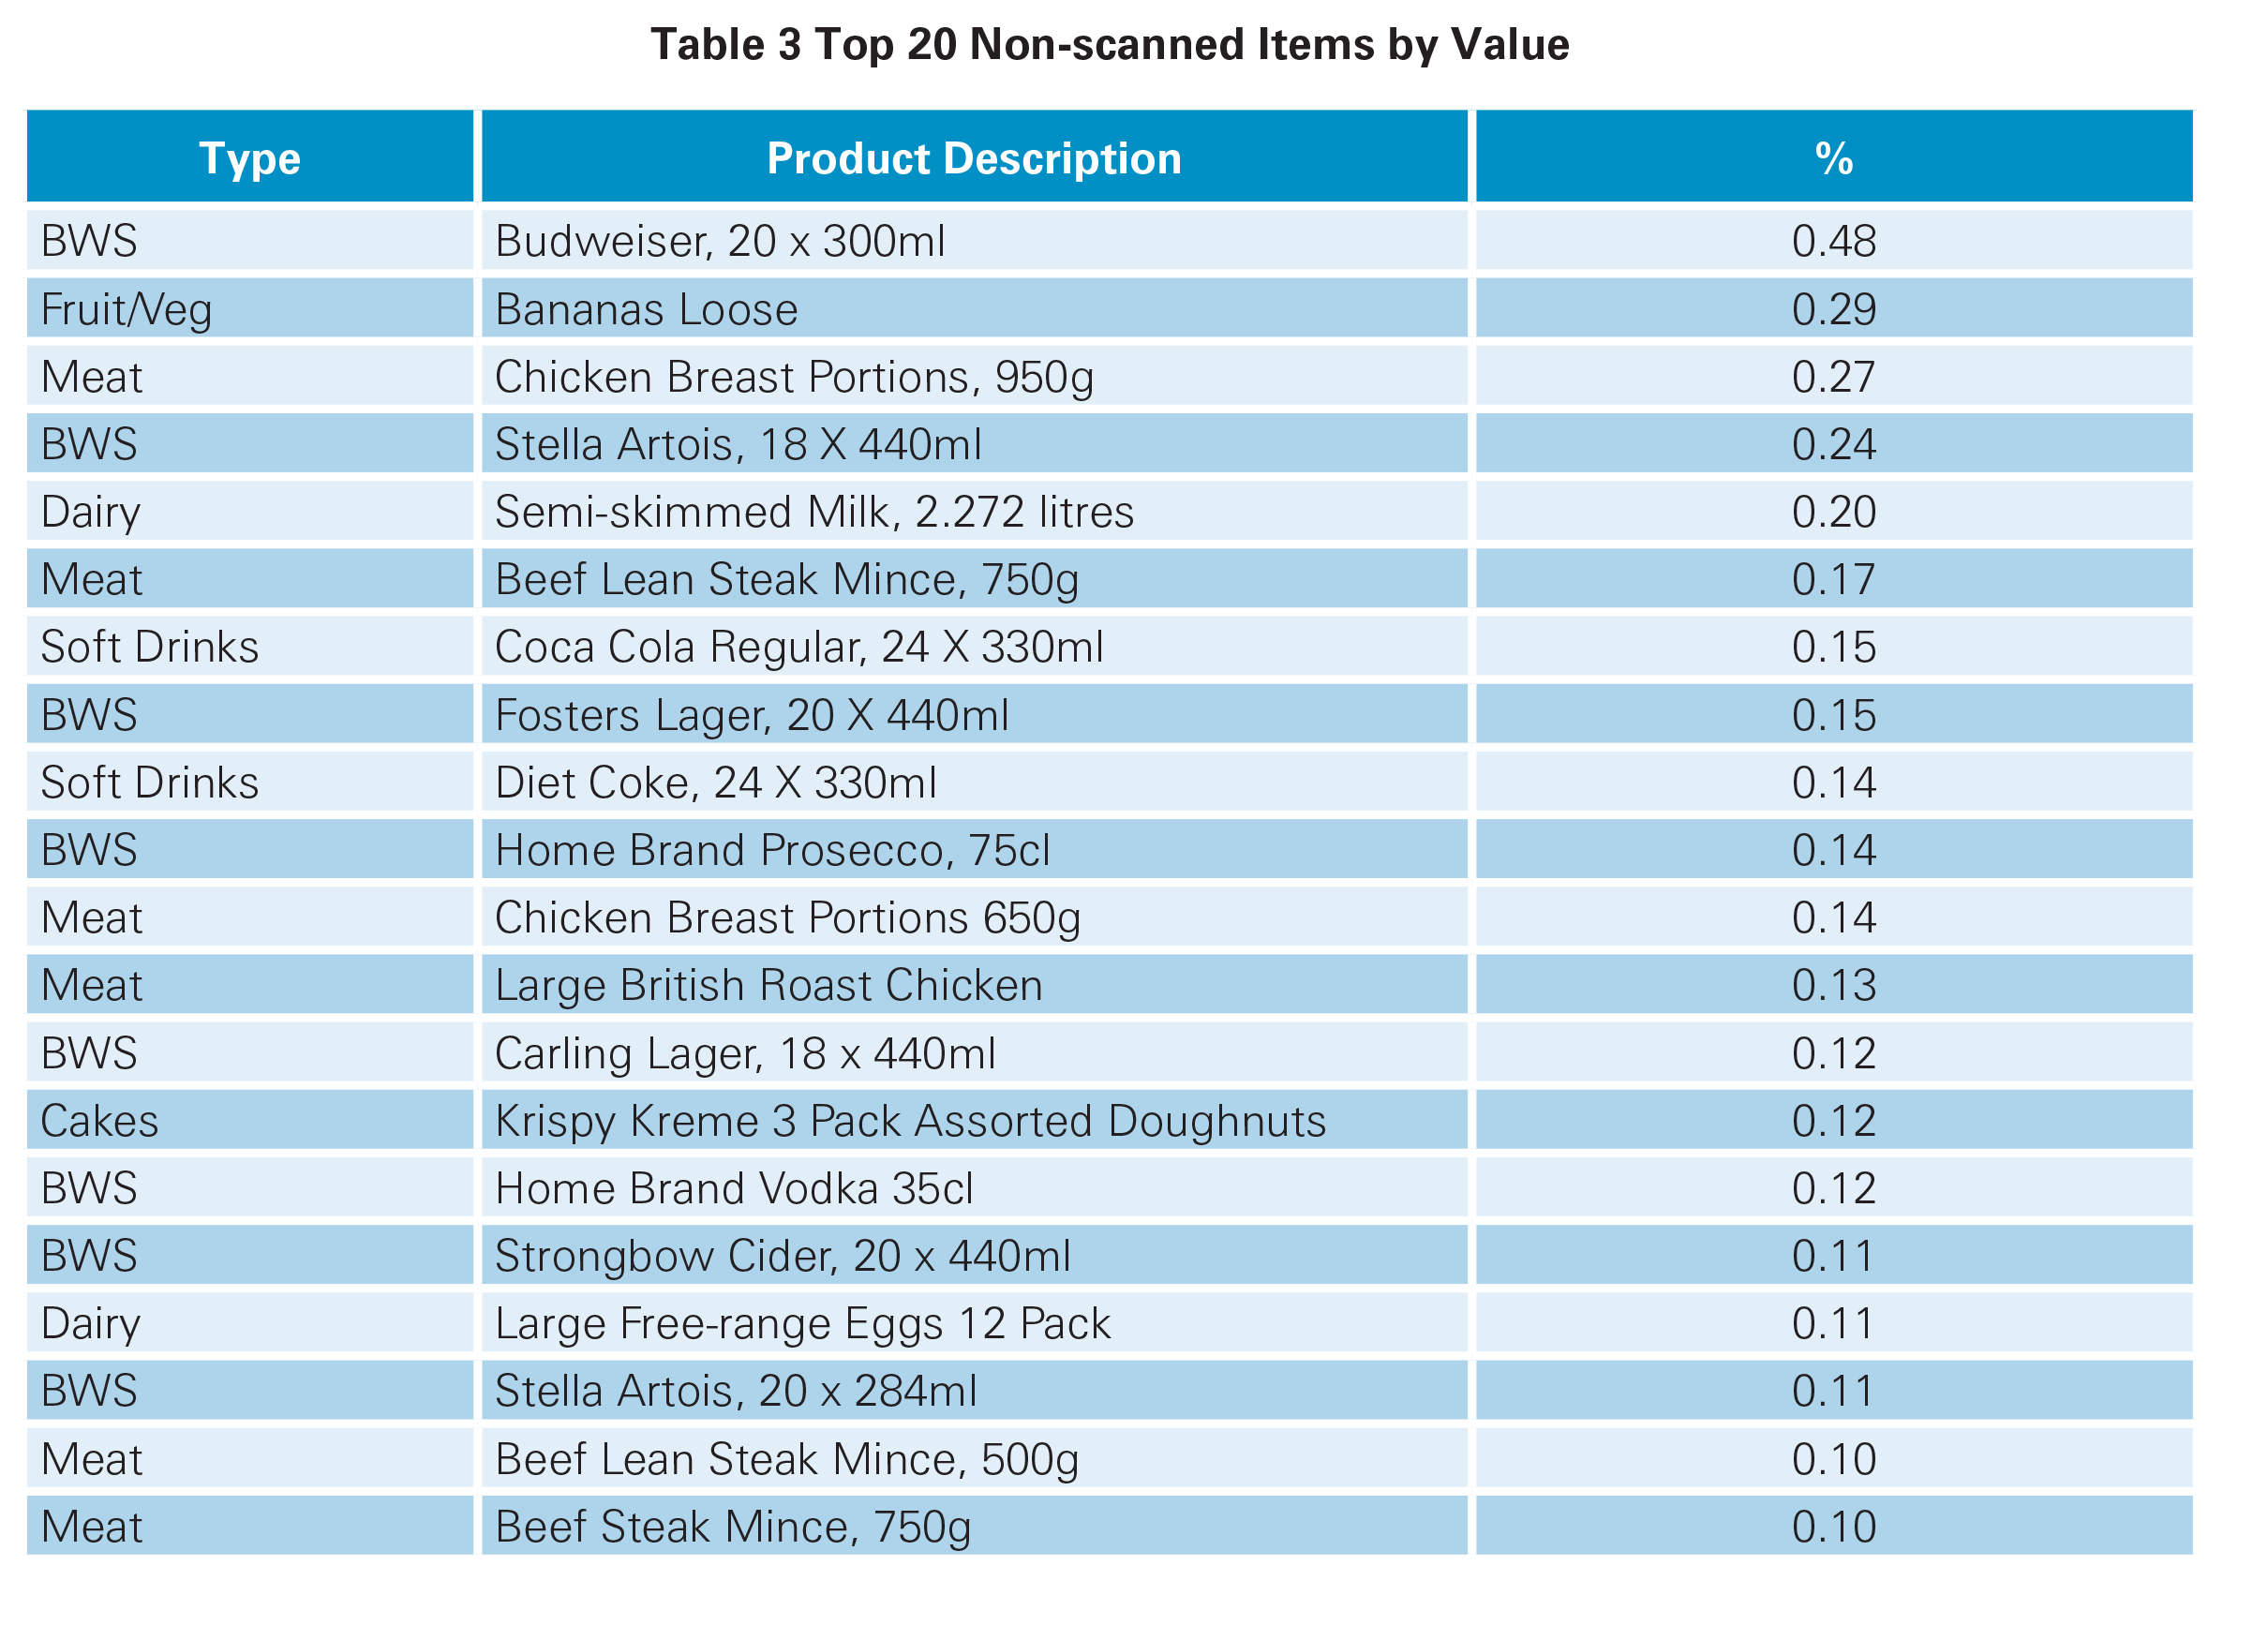
Table 3 presents the same type of data, but this time ranked by the total value of non-scanning rather than frequency. This provides a very different profile of products, with types of fruit/vegetables only appearing once on the list (Bananas in second place). Top of the list is 20 packs of bottles of Budweiser lager, accounting for 0.48% of the value of all non-scanned items. As can be seen, Beers, Wines and Spirits (BWS) account for 40% of the top 20 products, followed by a range of chicken and beef mince products, which accounted for 30% of the list. Together, BWS and Meats accounted for 80% of the top 20 products not scanned by value. Again, however, this top 20 list only accounted for 3.4% of the total value of all items found not to be scanned – highlighting the breadth of items not being scanned.
Discussions with the retailer providing this data suggested that the relatively high levels of non-scanning of packs of Budweiser in particular may be due to the application of multiple barcodes on the packaging, which was causing confusion and error. Only one item appears in both the frequency and value tables – loose bananas, suggesting that this is certainly a high-risk product when it comes to the use of SCO systems.
Estimating Losses Associated with Scan and Go SCO
The data suggests that Scan and Go Losses could be between 0.31% and 4.68% of sales, with the latter number probably being much near to reality than the former, although some caution is required as it is based only upon the experiences of one retailer. This could mean that for every 1% of Scan and Go Utilisation, retailers could be facing at least 0.7 and perhaps up to 10.4 Basis points of increased shrinkage. Even if the mid-point estimate is used from the data comparing stores with and without Scan and Go – 5 Basis points of loss per 1% of utilisation, this still represents additional losses for those companies sharing data of nearly €136 million. If the upper estimate is correct, then this is a frightening prospect that certainly brings into question the financial viability of the technology if such rates of loss were to prevail in the medium to long term. This may be further compounded by the relative inability, to any great extent, to recoup significant savings in staff costs through the introduction of this technology, as seen with Fixed SCO systems.
Controlling SCO: Keeping Shoppers Honest and Accurate
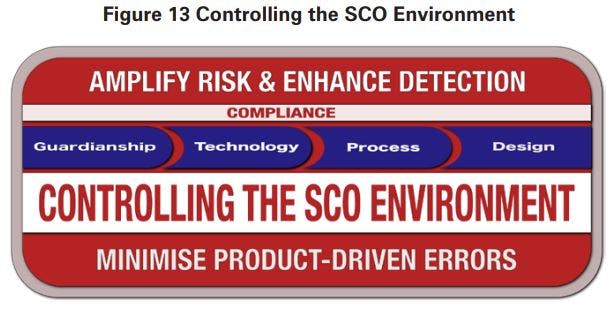
Outlined below is an overview of the various approaches that will be considered, organised around two key themes: minimising the impact of product-driven errors on the one hand, and the amplification of risk and enhancing detection on the other (Figure 13). Under the latter, four key areas are considered to be important although their capacity to control various types of SCO systems will vary: the role of guardianship, technologies, processes and design issues in amplifying risk and enhancing detection. Across these four areas, the importance of store-based compliance will also be critically reviewed – highlighting how each can be significantly undermined should it be compromised.
Minimising Product-driven Errors
The first key area to controlling losses through SCO is to try and minimise problems relating to the products on sale, particularly in the following three ways:
Packaging and Barcode Issues: respondents to this research highlighted numerous examples of where certain products and the way in which they were designed created confusion and scanning issues. Of particular concern was the use of multiple barcodes on some products creating significant errors. For instance, one alcohol-related product was displayed with both a shipment barcode and a product barcode visible – scanning the former did not record the sale but to a customer it could lead them to concluding it had scanned, or it simply would not scan and therefore was not their problem.

Set-up Issues: While product design and barcode issues were certainly generating concerns, a number of case-study companies also recognised that errors within their own organisations were creating problems. Such issues can cause not only direct losses (the shopper does not scan the item), but also considerable frustration for those using Scan and Go/Mobile SCO systems in particular.
Product Protection Issues: A number of respondents raised concerns about how product protection devices and technologies often conflicted with their SCO operations, not least how tags could be safely removed without compromising their role in securing high-risk products.
Amplifying Risk and Enhancing Detection
Previous research has considered the role risk amplification can play in deterring opportunistic retail thieves – elevating concerns about the likelihood of being caught17. However, given the relatively consequence-free environments that some SCO operations create, it also seems important to develop ways in which errant users can be identified and either prosecuted, or more likely, ‘educated’ about the retailer’s capacity to capture their wrongdoing and how to use SCO systems correctly.
In addition, the capacity of detection is also relevant in terms of identifying when a consumer may have made an error or where there is a higher likelihood that an error may be made, such as choosing between similar types of fruit or vegetables at a weigh station. Relating to SCO, there are four areas within which risk can be amplified and detection made more likely: guardianship; technologies; processes; and the design of SCO spaces. The capacity of these factors to control SCO systems will vary depending upon the type of SCO in use, for instance, Fixed SCO is currently being controlled primarily through guardianship, technologies and design, while Mobile Scan and Go/Mobile SCO is more reliant upon process-based strategies. However, as new ideas emerge, then this picture is likely to change.
Controlling Fixed SCO
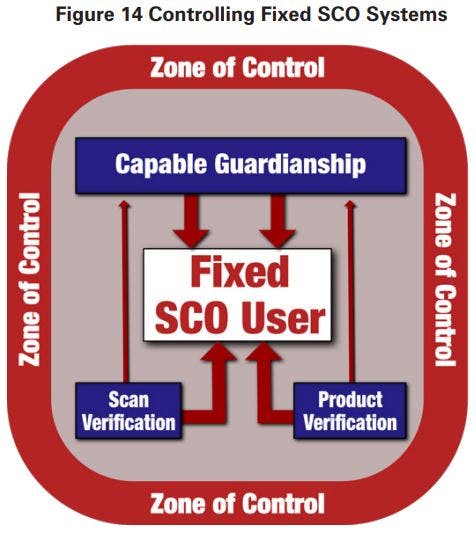
Figure 14 provides an overview of how Fixed SCO systems could be controlled.
Capable Guardianship
Across all types of interventions to control losses associated with Fixed SCO systems, the use and role of SCO supervisors was considered to be the most important by respondents to this research.
Effective SCO Supervision
Respondents considered the following themes to be important for effective SCO supervision:
Customer Engagement: making not only eye contact but also verbally interacting with the SCO users was considered important, but doing this in a way that was non-confrontational and service-focussed: ‘Anything that can make people think they are being watched and observed is good, but it has to be done in the right way – this is what is going to make the biggest difference’[R3]; ‘need to give SCO supervisors the confidence to step in when they see something suspicious’[R7].
"need to give SCO supervisors the confidence to step in when they see something suspicious"
Delivering Customer Training: using non-accusatorial techniques was considered an important skill for SCO supervisors to develop, to enable an errant shopper to not lose face yet at the same time recognise that they had been identified: ‘the rule of thumb is to put the attendant shoulder to shoulder with the shopper and turn a possible theft scenario into a coaching moment, so always make it non-confrontational, so make it as though the shopper has never tried to steal something rather the shopper has not correctly used the system’[R10]. Another respondent put forward a similar argument: ‘the fact that they [the shopper] have ended up with 10 yoghurts in their basket but only scanned three – let me help you with that as these items don’t seem to have scanned properly’[R14].
Customer Prioritisation: when SCO spaces get busy then the supervisory role becomes even more critical in managing customer expectations and keeping friction to a minimum. One respondent shared how they had developed training to help their supervisors manage often competing priorities: ‘we have a training programme for how you deal with multiple red lights on SCO and reading customer body language – who gets service first – mum with screaming kid versus bloke with a beer?’[R11]. Similarly, other respondents described how they encouraged SCO supervisors to scrutinise shoppers’ baskets as they entered SCO spaces to look for items that may require subsequent attention and/or be a known theft-risk.
"what you don’t want is the attendant hiding behind a podium and dealing with alerts remotely and not properly engaging with the shoppers"
Occupying the SCO Space: ensuring that supervisors occupied a central and visible location within the SCO environment was considered important in amplifying risk and improving their capacity to deal with alerts more quickly. A number of respondents highlighted their strategies to ensure they did not ‘hide away’ behind monitoring stations: ‘what you don’t want is the attendant hiding behind a podium and dealing with alerts remotely and not properly engaging with the shoppers; [we] can measure how many times a supervisor does remote cancellation of alerts to see whether some stores are above average’[R10].
Having Awareness of Risk: because of the unique risk characteristics of SCO spaces, it was also deemed important to ensure that SCO supervisors were given sufficient training to understand what they should be specifically looking for and how to react accordingly: ‘we are introducing more off the floor training to help them understand the risks present at SCOs – we need to make them aware of the various scams that we have seen at SCO’[R5]; ‘alerting staff to the exceptions is the key – how can you help them to look for the risky behaviours’[R10].
"alerting staff to the exceptions is the key – how can you help them to look for the risky behaviours"
Protecting the Brand: In some Fixed SCO environments, audits of customers using Scan and Go/Mobile SCO systems can also be carried out, and these events can often be viewed as an explicit personification of a retailer’s overt distrust of the user – ‘we are checking you because we are not sure you have scanned everything correctly’. Many respondents recognised this as a moment of tension for both the consumer and the SCO supervisor, particularly when un-scanned product is identified. It was felt that a welltrained SCO supervisor was critical at this moment: ‘The audit is a moment when you need to rebuild the brand with the customer – have empathy, educate them, make sure they are confident in using the technology’[R11].
Experience Counts: there was clear and unambiguous support for the notion that only experienced staff should be employed in SCO environments: ‘try and ensure only long-standing cashiers are used at SCO – the better personnel; what you definitely don’t want is the walking wounded’[R13].
"try and ensure only long-standing cashiers are used at SCO – the better personnel; what you definitely don’t want is the walking wounded"
Keeping Customers Honest and Accurate: as detailed earlier in this report, the SCO environment is potentially rich with opportunities for both malicious and non-malicious losses to occur, and so the role of the SCO supervisor is fundamentally about keeping the customer honest and accurate – to gently guide them away, through good customer service and vigilance, from the opportunities that they may be presented with to makes errors and/or abuse the system.
Number of Fixed SCOs per Supervisor
A perennial question discussed by retailers and their technology providers around the world is: what is the ‘right’ number of Fixed SCO machines that one supervisor should be expected to manage effectively? Perhaps not unsurprisingly, the number varied depending upon the retail context within which they were being used and the type of Fixed SCO technology employed. But, overall, of the 10 case-study companies who were prepared to suggest what they considered to be the ‘right’ number of machines to ensure they could be adequately supervised, there was remarkably little variance – between 5-6 machines was considered to be the appropriate number.
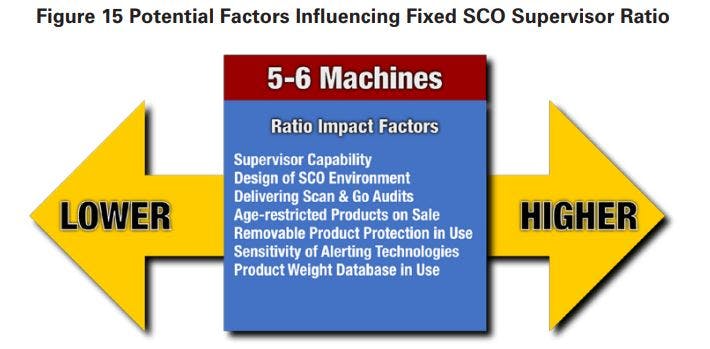
Of course, this does not mean that this was the number being utilised by these retailers and even where it was, there was always the challenge of store compliance with agreed directives (see below). For some respondents, the ratio could be altered depending upon the layers of complexity/requirements imposed upon the SCO space and their subsequent impact upon the capacity of the SCO supervisor to manage the ensuing interventions. For instance, where there was no weight-checking security functionality, age-related products and/or perhaps product protection devices installed, then it was felt the ratio could be higher.
For many, the challenge often cited was ensuring that agreed ratios were adhered to as customer velocity fluctuated through trading times although one approach to this problem was controlling the number of Fixed SCO machines that were open for use. In summary, use context would appear critical in determining the Fixed SCO Supervisor Ratio, with a number of factors influencing this context (summarised in Figure 15).
Utilising Technologies
Retailers taking part in this research were utilising relatively few technologies to try and manage the issue of SCO-related losses, although a number were looking at a range of them. There are two main areas where technologies have either been utilised already or are in trial and development mode: Scan Verification Technologies; and Product Verification Technologies.
Scan Verification Technologies
Weight-based Systems
Of the companies taking part in this research three had taken the decision to turn off their weight-based system, primarily because of a desire to prioritise the reduction of frustration for the user caused by alerts: ‘weight scales – it caused so many interventions that we took the decision to switch it off’[R9]. For another, they fully realised that this decision would likely negatively impact upon levels of loss but felt it was worth it: ‘do I expect those numbers [losses] to be positive, no doubt, but, we don’t want to turn the weight scales back on, that would be a failure point if we had to do that to get to the same level of loss’[R11].
Others have had a number of internal debates about whether they should follow suit although for the time being all remained committed to its use: ‘we did think about turning it off completely but it was seen as a step too far for the business at that time[R14]; ‘the weight system is a real battle for us because we know it causes such frustration, but we don’t want to switch it off, but it is a tough one to know what to do with’[R4].
"weight scales – it caused so many interventions that we took the decision to switch it off"
A third group of respondents remained fully committed to the use of a weightbased control system, viewing it as a key strategy in their attempts to control Fixed SCO-related losses. As one of the technology provider respondents put it: ‘you cannot remove “the guardian is watching” component without adverse consequences; I think the people who have turned off the weight checking system have made a mistake’[R8]; ‘in this company there is a firm defence on the value of weigh scales – this is our safety net’[R9]. For another respondent, the concern with turning off the system was that it would be very difficult at any future point in time to turn it back on without generating a considerable amount of adverse customer reaction: ‘the problem with turning off the weight-based system is that it is very hard to go back without generating very negative customer feedback’[R10].
"we did think about turning it off completely but it was seen as a step too far for the business at that time"
There was a final group who, having recognised both the benefits the system can bring and the benefits that can also accrue from not using it, had decided to adapt their usage to try and assuage both sides of the debate – striking a better balance between controlling loss and still reducing customer frustration. For some this involved selectively turning the system off at peak times of use: ‘has been a lot of discussion about interventions and whether the weight scale can be switched off at peak periods which now happens’[R5]. For others it was about adjusting the degree of sensitivity to reduce the number of alerts:
We took an active decision 18 months ago, based upon a service decision rather than a shrink perspective to turn down the weight sensitivity on the SCOs so that the first mis-match will be ignored but subsequent ones will be triggered. We didn’t find a big increase in shrink as a consequence of this, but we did find that customers were a lot happier[R14].
In reviewing the data presented earlier in this report and the views offered by the retailers taking part, abandoning one of the few established methods of controlling Fixed SCO-based losses would seem to be a risky strategy to adopt – there are so few opportunities currently available to try and manage these risks. What would seem more sensible is to try and adapt the technology to take account of any given context and work to achieve a more acceptable balance between maintaining a degree of risk amplification while minimising customer frustrations.
"you cannot remove “the guardian is watching” component without adverse consequences"
Non-scanning Alert Technologies
Only a small number of the case-study companies had either trialled or were currently using technologies that aimed to identify when a consumer had not scanned an item at a Fixed SCO machine. Using a combination of video analytics linked to EPOS systems, this technology seeks to generate alerts when a consumer attempts to pass items across or around the scanning area without actually registering the sale (18). In addition to trying to identify non-scanning activity the technology can also be used in association with weight-based systems to try and reduce the number of false alerts generated by them – in effect offering a first review when an alert is triggered to see if it warrants further action by a SCO Supervisor.
Product Verification Technologies
None of the respondents had begun to actively use and roll out Product Verification Technologies at this stage, although some were actively looking into their use. As detailed earlier, after non-scanning, misscanning of product is probably the second largest cause of SCO-related losses – particularly on items that need to be weighed.
What Product Verification Technologies aim to do is enable the identification of products from images captured at SCO machines to either confront the user with an image clearly showing a discrepancy between what is being claimed and what is actually present at the checkout, with the option to alert a SCO supervisor, and/or provide the user with a more selective list of possible options to choose from, speeding up the purchasing process.
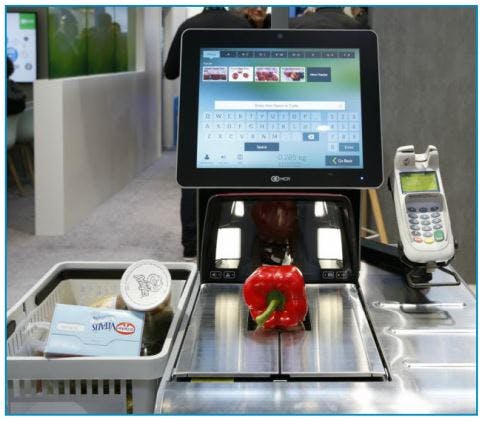
Respondents to this research were openly supportive of the development of this technology but many felt that it was still an emerging option: ‘if we can get product recognition, then that would be utopia wouldn’t it, but not sure it is there yet’[R5]; ‘seems like a good idea but it mustn’t slow down the transaction time because the system is constantly checking’[R13]. The technology providers interviewed for this study felt that they were making good progress with product verification but were keen to counsel caution about what is still realistically achievable: ‘it is challenging to get product recognition to work well at the moment but we have a road map for getting there at some point; it is still hard to accurately differentiate between similar looking products[R1].
"if we can get product recognition, then that would be utopia wouldn’t it, but not sure it is there yet"
Designing the Fixed SCO Environment
Previous research has looked at how the built environment can influence the likelihood of crime to occur (19). Respondents to this research recognised the importance of design and how mistakes had been made in the past: ‘I think our biggest issue with SCO is a design issue – we have just put them where they will fit in the stores – any spare space available’[R12]. While attitudes differed on the most appropriate design to generate control while minimising customer friction, all agreed that the space had to purvey a sense of control, with clearly designated entrances and exit points and a layout that enabled good line of sight for supervisors: ‘we have lines and lines of machines – really hard for SCO Supervisors to manage them’[R2]. For some the Corral and/or Bull Pen was the preferred design although these often-raised issues abut effective space utilisation and customer use:
[we] feel that the corral design is better for deterrence – zones of control. Obviously, a space issue, it affects utilisation – reduces it, consumer doesn’t know where to go. Design matters but we don’t have data at the moment to understand the impact[R6].
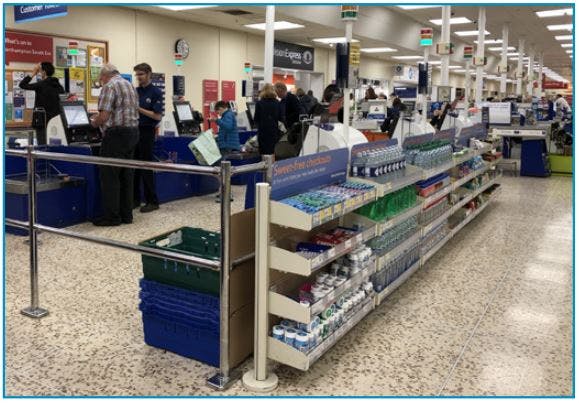
Given the important role the SCO Supervisor can play in controlling losses and creating a sense of control, understanding where and how they will be positioned in this space would seem key, especially in environments where they are expected to manage large numbers of machines.
Some respondents had installed video monitors in this space to help create a sense of control and oversight – mainly in the form of Public Display Monitors, but also more personalised displays positioned on the Fixed SCO machines themselves. In terms of the latter, views varied on their applicability with some considering them a potential tool to help try and amplify the sense of risk, while others were slightly more sanguine about what role they might play. Currently there is no available evidence to understand whether this technology makes any difference or not to levels of SCO losses.
Controlling Scan and Go/Mobile SCO
In comparison with Fixed SCO systems, Scan and Go/Mobile SCO currently offers far fewer opportunities to amplify risk and enhance detection. The majority of controls described by respondents were focussed particularly upon processes. Six process areas where identified: securing robust user identification; ensuring consumer expectations are properly managed; delivering a credible audit strategy; utilising fixed payment points; communicating with users; and developing a manageable customer exit control strategy; (Figure 16).
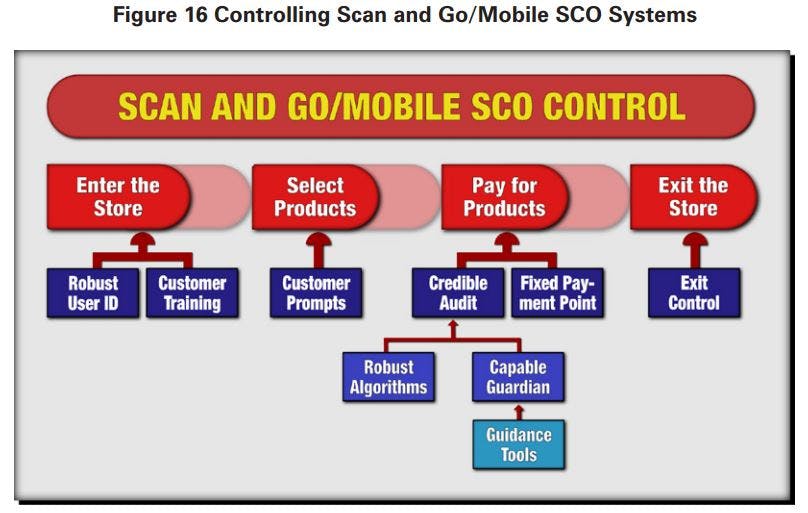
Robust User Identification: practices varied enormously with many trying to both encourage adoption and impose some form of control at the same time: ‘the first moment of truth is key to get right – minimise anonymity enough without putting people off using the system; hard to get this balance right[R11]. For some the identity verification bar was set very low indeed: ‘anybody can walk in and pick up a scan gun – no checking at all’[R12]; ‘need to have a loyalty card to participate in the scheme, but you only have to provide an address to get one, any address, we don’t verify it’[R5]. For others the bar was slightly higher: ‘need an email account but there is no validation of the email account’[R6].
While it is understandable that retailers investing in Scan and Go systems want to encourage as much utilisation as possible, it would seem prudent, given the extent of losses outlined earlier, that a robust process is put in place that ensures that users can be accurately and consistently identified as they embark upon a Scan and Go shopping journey.
Establishing User Expectations: respondents to this research were very clear that their businesses should only be offering this facility to those who clearly understood the ‘rules of the game’ – that it is a privilege and not a right to access this way of shopping and that it came with clearly defined expectations on the part of the retailer providing the service (20).
Respondents varied on whether new users should always be audited on their first trip: ‘there is no policy around whether you should or should not be audited the first time you use it’[R9]; ‘customers will always be checked on the first trip; it forces the cashier to get fluent with the system and to educate the shopper and a strong impression of control from the get go’[R2]. It would certainly seem sensible that all new users were audited on their first use of the system – set the tone and provide an opportunity for customer education and risk amplification.
Delivering Credible Audits: respondents used two ways to do this – the use of algorithms to select users for audit and the training and support provided to supervisors undertaking them. Detailed below (Table 7) are a range of factors used to build audit-trigger algorithms. Some are focussed upon the user themselves – their previous audit history, frequency of use etc., others are based upon the specifics of the current shopping journey – scan times, voiding activity, dwell times etc., while others are product focussed – high price items, security-protected items, age restricted items etc.
"customers will always be checked on the first trip; it forces the cashier to get fluent with the system and to educate the shopper and a strong impression of control from the get go"
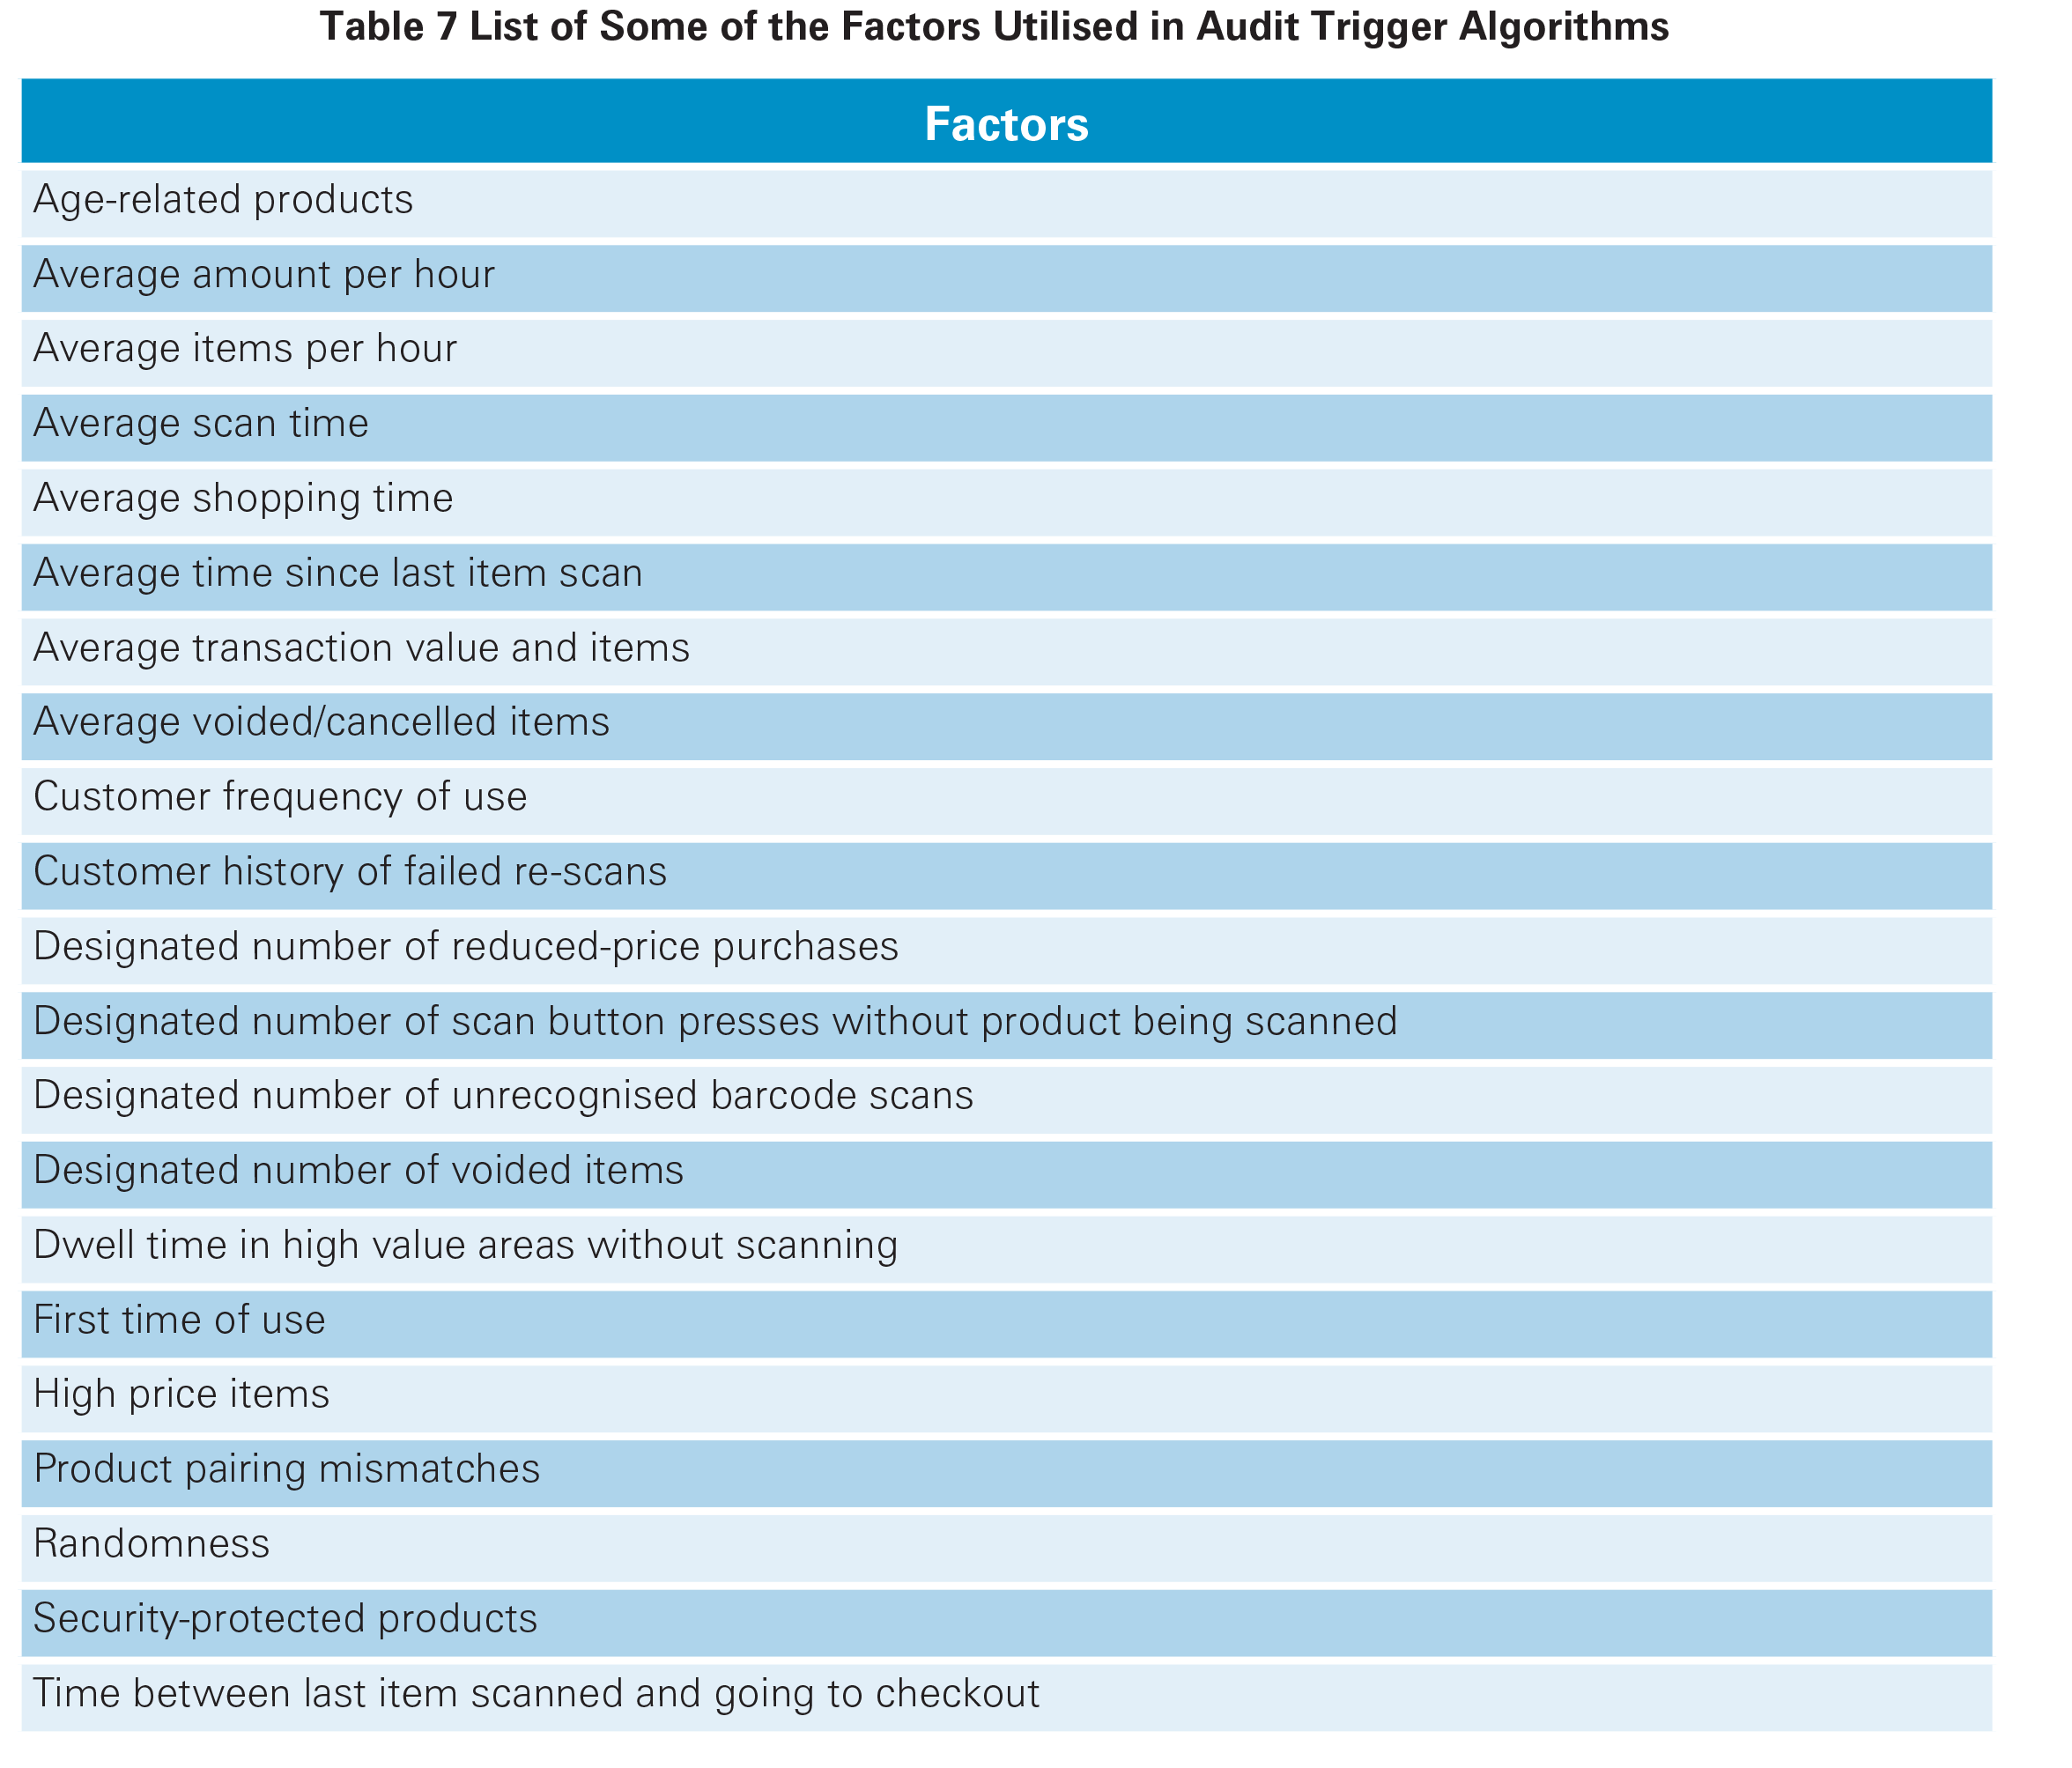
A number of respondents highlighted the importance of improving their algorithms to identify those with potential errors in their baskets/trolleys: ‘my team has got to put effort into how we do better audits; how do we get audits that are more behavioural – time gaps, product matches, do less audits but more deeper audits’[R4].
"my team has got to put effort into how we do better audits; how do we get audits that are more behavioural – time gaps, product matches, do less audits but more deeper audits"
While Audit Algorithms can be developed and refined to theoretically identify those who are more likely to require a check, their execution is dependent upon a member of staff carrying them out and doing so effectively. Respondents identified a series of ways in which they were trying to improve the capability of the Audit Supervisor, including providing some system-driven tools to help them in their selection:
- A ranked list of items in the basket by value –if a supervisor sees other higher-priced items not appearing on the list, then they have not been scanned.
- A list of weighted items that have the exact same weight – potential evidence of mis-scanning.
- A list of promotional items – may be indicative of a buy one-get-one free error.
- A list of above average numbers of particular products that are known to be involved in mis-scanning scams – more than 3 bags of carrots for instance.
- Lists of products where multi-varieties are typically selected.
Some respondents also provided SCO supervisors with the capacity to trigger either a partial or full re-scan independent of any existing algorithmbased selection process. This could be based upon knowledge that the Supervisor has about a Scan and Go user, or they are concerned about the products that they have seen in a trolley/basket, such as age-restricted items not triggering an intervention alert.
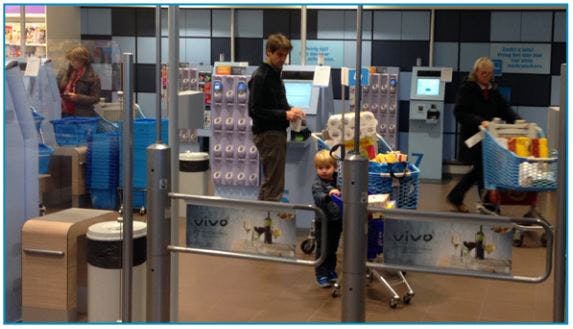
Utilising Fixed Payment Points: Currently, all existing iterations of Scan and Go SCO systems require the user to present themselves at a fixed point to arrange for payment to be made – the Scan Gun needs to be docked in order for the shopper data to be transferred and processed and, where necessary an audit triggered. This was regarded by many respondents as a fundamental control point: ‘[they] have to go to a fixed point of payment – it is key to getting any sense of control over this stuff’[R6].
However, respondents were much more concerned about variants of Mobile Scan and Go SCO where the option to make payment on personal devices at any place in the store is provided. Others were equally anxious, if not incredulous that retail businesses were even contemplating this: ‘if you are leaving them [customers] loose in the aisle to, you know, choose three items and then choose payment and then run for the door, you know, well good luck with that!’[R8].
"[they] have to go to a fixed point of payment – it is key to getting any sense of control over this stuff"
Communicating with Users: A number of respondents described ways in which they were thinking about how they might be able to communicate with users to encourage compliance, particularly with mobile SCO users through the App (21). The idea being that users would be reminded of the importance of scanning all items properly and consistently, and/or prompted at the end of the shopping journey, but prior to payment, to tick a box declaring that they had scanned everything accurately.
Exit Control Strategies: One option being considered by some respondents was to develop a process whereby Mobile SCO users will be required to exit through designated areas, often with barriers being opened via a uniquelygenerated code, which is viewable only when payment had been confirmed.
"if you are leaving them [customers] loose in the aisle to, you know, choose three items and then choose payment and then run for the door, you know, well good luck with that!"
Controlling the SCO Environment Dynamically
The effectiveness and suitability of any given intervention will vary depending upon the specific retail contexts within which they are being utilised – what might be appropriate for one location, time or product might not be suitable for another; understanding the risk and operating landscape becomes key.
In the context of SCO, this same principle applies; the application of the range of interventions described above may very well need to be tailored to suit different circumstances and requirements of the business environments in which they will operate. For instance, customer velocities may well mean that it is appropriate to adjust the number of alerts generated at any given time. More broadly, accurate risk assessments of retail stores could mean that for those with a low risk, their range of SCO-related security measures is reduced compared with high risk stores.
"if you are leaving them [customers] loose in the aisle to, you know, choose three items and then choose payment and then run for the door, you know, well good luck with that!"
Role of Compliance
The issues of compliance were raised by a number of respondents. As detailed earlier, getting capable store staff working in the SCO environment can be challenging – some store managers have used it as a place to park the ‘walking wounded’, those who are not considered suitable to carry out other customer-facing activities. In addition, while stores are often given clear direction on the amount of staff hours that have been allocated to managing SCO, ensuring that this actually happens was another area of common concern. It seems clear, therefore, that store teams need to be clearly guided on why agreed practices and policies relating to the control of SCO systems need to be rigorously and consistently enforced.
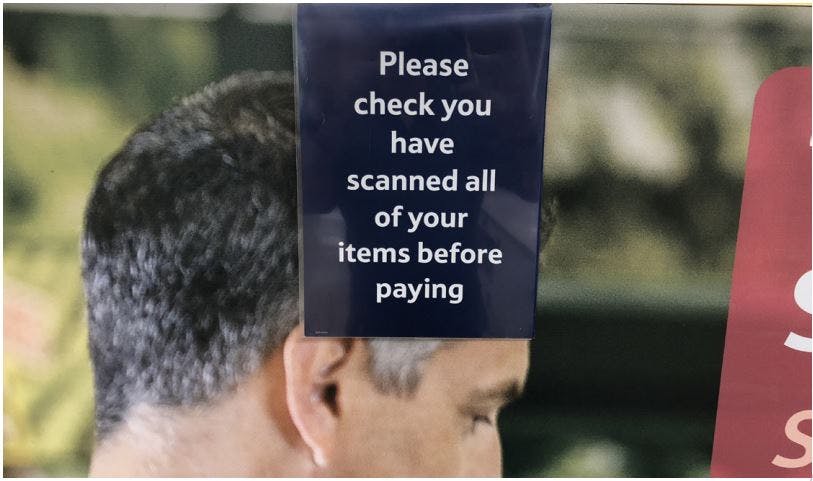
Conclusions
For many respondents to this research, their evolving SCO strategies were increasingly intertwined with broader business priorities focussed on radically reconceptualising and imaging the future retail environment. While early business cases for Fixed SCO systems were built principally upon the significant cost savings that they could bring, the picture is now much more nuanced, with a suite of SCO technologies being introduced that are as much about offering consumer choice and convenience as they are about reducing costs.
The key findings from this research can be summarised as follows:
- There has been a distinct lack of prioritisation of the collection of data to understand the true picture of SCO-related losses.
- It is estimated that losses from Fixed SCO systems amount to 1 Basis point of loss per 1% of utilisation.
- It is estimated that the losses from Scan and Go systems could range between 0.7 and 10.4 Basis points of loss per 1% of utilisation.
- The control of the Fixed SCO environment needs to focus upon developing a clear zone of control, which emphasises the amplification of risk and the organisation’s commitment to delivering a high level of customer service, through the use of well trained and incentivised capable guardians. Retailers should also consider the use of both Scan Verification and increasingly, as they evolve, Product Verification technologies to support their work. Through a combination of these factors, operating within a culture of compliance and dynamic application, this may be the most comprehensive approach to adopt.
- The control of Scan and Go/Mobile SCO should focus primarily upon six areas: robust and verifiable user identification; good customer training to ensure they fully understand the ‘rules of the game’; credible audits based upon robust algorithms and capable guardians; the capacity to communicate risk to users, the use of fixed payment points; and potentially exit gates to enhance a sense of control.
- The research also identified that there was a lack of cross-functional collaboration to deal with some of the issues created by the use of SCO systems, such as barcode issues on packaging. In addition, the research raises questions about the extent to which the Loss Prevention function is not only engaged in the SCO utilisation decision-making process, but also the extent to which it can be held accountable for the additional losses generated by this technology.
Developing a Framework to Manage SCO in Retailing
Using a variant of an existing loss prevention model, detailed below is a framework for how retail businesses can go about developing an organisation-wide approach to managing the risk associated with use of SCO systems (22).
Senior Management Commitment: Without recognition from senior management that the issue of developing a balanced scorecard to understand the impact of SCO investments is important, then any attempts to mitigate and control losses will be unlikely to succeed. Having this commitment provides access to resources, generates urgency within the business and most importantly, ensures that the rest of the organisation is more likely to be compliant with any agreed strategy (23).
Organisational Ownership and Embedding Responsibility: As with most LP-related issues, without the rest of the business agreeing to play a role, then it is unlikely a successful and sustainable outcome is likely to be achieved. For many of the retailers there has been a degree of tension between those parts of the business wishing to push forward with an agenda to transform the consumer experience through reducing friction, particularly around the front end, and those tasked with managing retail losses. What seems key is that other retail functions involved in the development and management of SCO systems do not abrogate all responsibility for any adverse outcomes from their use; they need to recognise and take some responsibility for ensuring that the use of SCO systems operate in way that is beneficial to the business as a whole.
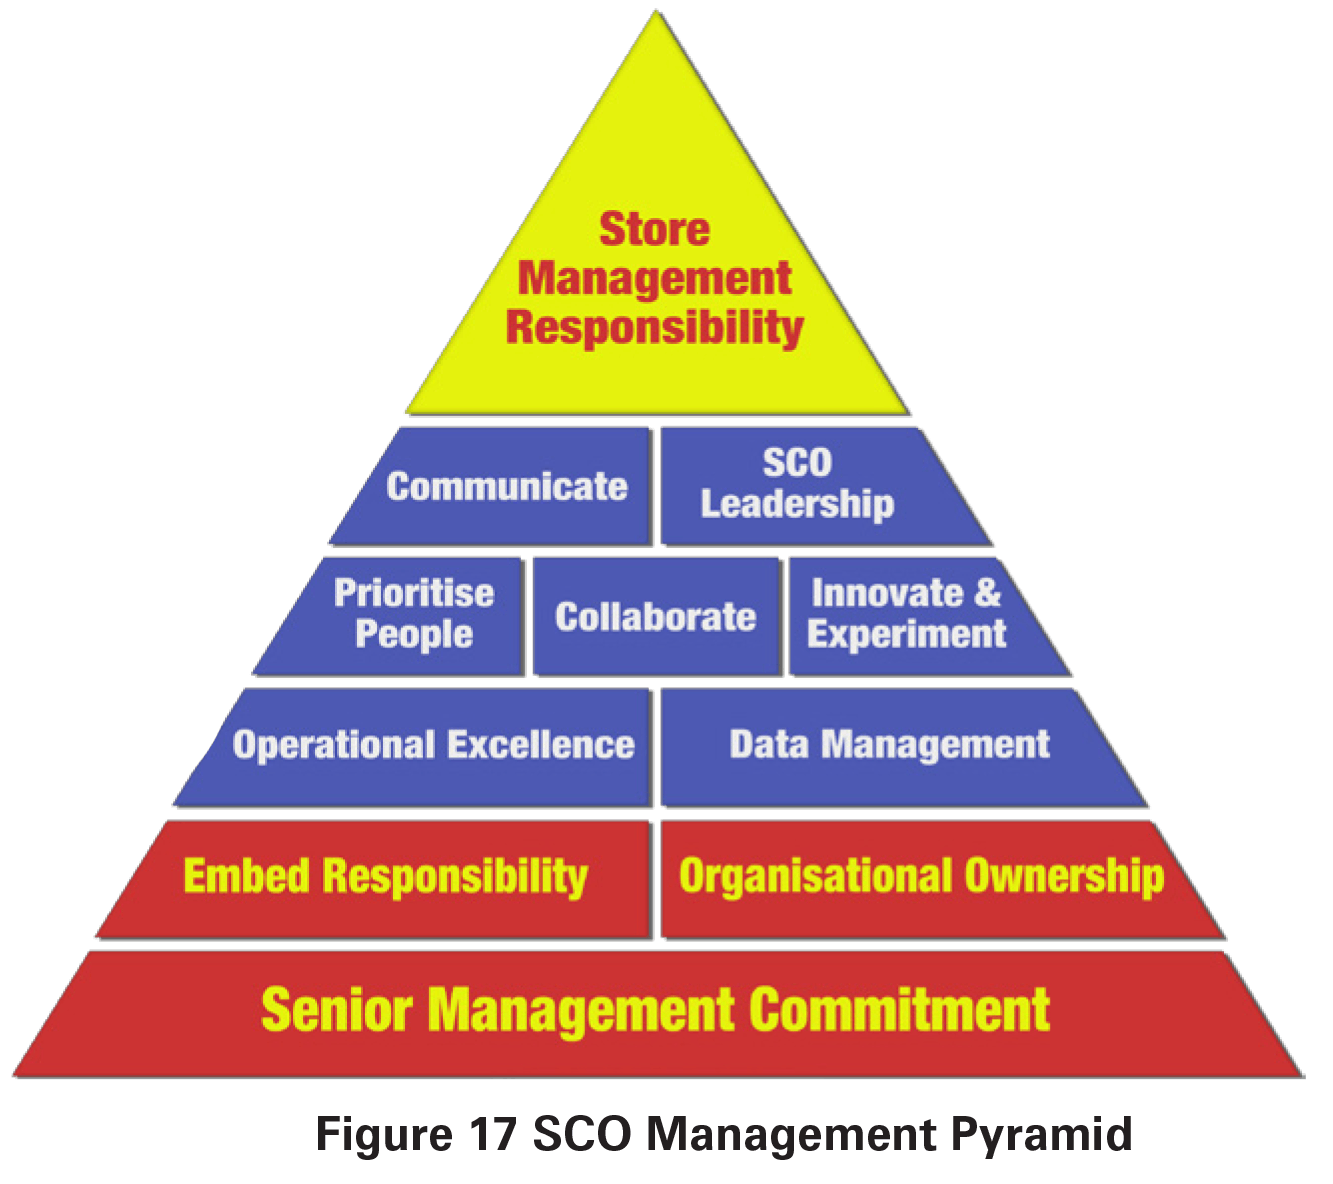
Data Management: This report has provided evidence on both the challenges of collecting data on SCO systems and the current lack of prioritisation within many businesses to collect meaningful data to help them fully understand the negative consequences of their use. Retailers need to ensure that they have developed a clear set of data protocols to fully understand the impact of various types of SCO technologies on their businesses.
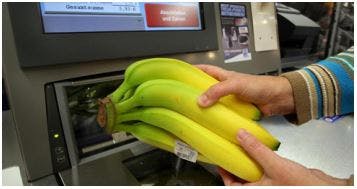
Operational Excellence: Section 5 outlined the various ways in which different types of SCO technologies might best be controlled, focussing particularly upon ways to amplify risk and enhance detection, and minimise product-driven errors. Across all of the approaches described, the issue of compliance was considered key – ensuring that the policies, procedures and practices agreed by the business were actually delivered in practice. Retailers need to ensure that the future use of SCO systems are firmly grounded in a philosophy of operational excellence – developing, wherever possible, business practices and procedures that ensure they are a benefit and not a liability to the company.
Innovation and Experimentation: The use and abuse of SCO systems is a rapidly evolving space and so retail users need to be prepared to constantly innovate and experiment to understand how risk is changing and what new approaches and technologies might be available to manage these risks. As described in Section 5, new SCO-related technologies are developing quickly, such as product recognition systems, and so it is important that retail companies continue to actively prioritise a programme of SCO-related innovation and experimentation.
Collaboration: There is a need for retailers, product manufacturers and SCO technology providers to work together much more closely to not only understand SCO-related risks, but also develop and evaluate interventions that may help mitigate them. Retailers also need to ensure that there is better collaboration within their own organisations – that those tasked with risk management are an active and welcome contributor to current and future discussions on SCO-related store developments.
Prioritising People: The study identified the key role SCO supervisors can play in providing control and yet many respondents also highlighted how they had not been prioritised in their businesses. Too often the ‘walking wounded’ were given responsibility for managing the SCO environment when in fact what is needed is somebody who is highly experienced, outgoing, customer-focussed and highly attuned with the peculiarities of this demanding and risky space.
SCO Leadership: For many retailers using SCO systems, the drive is to yet further increase the proportion of customer transactions being processed through them – the development curve seems to suggest that there will be more not less SCO in the future. It is important, therefore, that there is clear and strong leadership that can articulate all aspects of its use within retailing, including not only the possible benefits but also the likely risks. To date, much of the emphasis has been on the former and, given the data presented in this report, it would seem that SCO Leadership teams now need to take much more account of the latter.
Communication: Retailers need to ensure that their businesses are kept fully abreast of the impact of SCO. Unless there is clear and consistent communication of robust and reliable data on SCO, retailers will continue to struggle to develop a coherent and profitable strategy for their ongoing and future use.
Store Management Responsibility: The management of SCO systems is dependent upon store teams and it is important, therefore, that they are giving the support to enable them to take on this responsibility. They need to be given the data to understand the challenges, the training, resources and technological tools to create an environment that minimises risk, and incentivised to ensure that they remain compliant.
The 11 elements of the pyramid offer an approach to begin to develop a more coherent and co-ordinated strategy to begin to better manage the risks associated with SCO systems in retailing, one that continues to recognise the benefits, but also takes account of the challenges that they also present.
Future Research
This research has been extremely difficult to deliver, not least because of the considerable challenges it faced in getting reliable and comparable data from multiple retailers on different types of SCO systems. This data ‘vacuum’ is one of the most revealing and unintended findings from this study – the almost complete lack of prioritisation of the collection of data on the potentially negative impacts of SCO systems. It is hoped that this research process has triggered a greater acceptance amongst retailers and technology providers that they need to invest in filling this vacuum to ensure that future SCO business cases are robust and realistic when mapping out the overall ROI.
In many respects this study has just scratched the surface in beginning to understand the risk landscape within which SCO systems reside and future research is undoubtedly needed. Detailed below possible areas for future research:
What impact do various types of intervention have on levels of loss associated with SCO systems, such as public display monitors, messaging, weight-based systems etc?
- What tools, training and techniques can be provided to SCO Supervisors to improve their performance?
- How might mis-scanning at Fixed SCO machines in particular be better measured?
- How can the store environment be best designed to improve the capacity to deliver a SCO Zone of Control?
- What combination of variables (shopper focussed, shopping activity indicators and product-related factors) are most likely to identify non-scanning behaviour when using Scan and Go/Mobile SCO?
- How can the reliability of Partial Re-scans be improved?
- What are the rates of loss associated with Mobile Scan and Go Systems?
- How do rates of loss relating to Scan and Go/Mobile SCO vary between retailers that do and do not have overt forms of exit and entrance controls?
- How can the rates of loss from lost margin and out of stocks caused by SCO systems be calculated?
- How might video analytics and other in-aisle technologies be used to recognise non-scanning behaviour?
Appendix: Methodology
The purpose of this research was twofold: first, to better understand how retailers are currently experiencing losses associated with the main types of SCO systems in operation; and secondly, to review the current approaches and practices being used and developed to control these losses. The study adopted three main methodologies: the collection of a range of quantitative data points from retail companies agreeing to participate in the study; qualitative interviews with key stakeholders in retail and SCO technology-provider companies; and visits to case-study company stores to review and assess SCO technologies currently in use and the methods being used to control them.
Inevitably, as with much of the research carried out on retailing, particularly where some of the information required can be regarded as highly sensitive and potentially competitive in nature, company selection ends up being driven more by willingness to engage than any overarching systematic methodological framework. In this study, a series of retail networks were contacted to encourage companies to participate in the research. These were primarily provided by: the ECR Community Shrinkage and On-shelf Availability Group (one of the key sponsors of the research); and the Retail Industry Leaders Association (RILA) in the USA. This combined list covered virtually all of the major SCO users in Europe and the USA.
In total, 13 retail companies agreed to participate in this study – six based in the UK, two in mainland Europe and five in the US. Collectively, they are some of the largest users of SCO technologies, with a combined annual turnover of €586 billion. The companies that agreed to take part include: Ahold Delhaize, Asda, Co-op, Jumbo, Kroger, Marks & Spencer, Meijer, Target, Tesco, Waitrose, and Walmart. In addition, representatives from two SCO technology providers were interviewed as part of the research, with one of them, NCR, agreeing to provide some financial support to enable the researcher to engage with a broader sample of retail companies.
It is worth noting that a number of retail companies initially agreed to take part in this study but had to withdraw because they discovered they had no quantitative data of any value within their businesses to understand the impact of SCO. This included some large multi-national retailers using many thousands of SCO machines. Others who did agree to participate found that when they began to collate the required data it was frequently of very poor quality, lacking a sufficient degree of robustness to enable any meaningful analysis to be undertaken. As detailed elsewhere in this report, a key finding has been the paucity of data held by retail companies using SCO technologies to understand their impact on losses and this factor certainly impacted upon the capacity of this project to meet its original aims and objectives.
The Collecting of Quantitative Data
Fixed SCO Systems
As detailed in the main body of the report, measuring the impact of fixed SCO technologies is not easy; trying to measure the absence of something (non-scanning) or product switching (carrots for grapes) for instance, is inherently difficult. The outcome of these behaviours (loss stock, lost margin and lost sales due to stock inaccuracies) are only likely to be identified and measured once routine audits are undertaken, and even then, ascribing responsibility to SCO systems rather than all the other myriad ways in which they could have occurred in a busy retail space is naturally difficult. However, some retailers were able to provide some data points, which are described below: (24)
With and Without Comparisons: measuring rates of loss between those stores utilising the technology and those not using it. This method requires that comparable types of stores are used to make sure the results are meaningful. If they are not then any subsequent differences in results can be difficult to ascribe to the SCO systems rather than a number of other factors that might generate differential rates of loss such as location, type of store, service models etc.
SCO Utilisation Studies: this data compares rates of loss in stores with varying degrees of SCO utilisation, typically measured in the number of Fixed SCO devices installed. As with the previous method, it does require that effort is made to compare stores with similar characteristics other than SCO utilisation otherwise differences in rates of loss will be difficult to attribute.
SCO Variant Comparisons: as retailers introduce different types of Fixed SCO systems, such as card only machines and those with and without a weight checking functionality, it is possible to compare rates of loss for stores with different systems and combinations of technologies. As with the approaches above, ensuring that comparisons between types of stores is valid remains key to ensuring any differences in rates of loss can be attributed appropriately.
Technology Monitoring: some technology companies now offer systems that claim to monitor fixed SCO systems and track and provide alerts when a user does not scan an item properly. For the most part, these systems tend to only provide alerts when an item seems to have not been scanned and do not provide any awareness of losses due to product switching, rarely capture products left in the trolley/basket and do not measure the extent of walk-away losses. However, given the relative lack of information available about Fixed SCO systems, they do offer a window on the scale and value of losses not seen thus far.
Video and EPOS Monitoring Trials: provided there is sufficient good quality CCTV coverage in a Fixed SCO area and a company is prepared to invest resources for a period of time, it is possible to undertake a visual analysis of transactions to systematically review, record and codify all incidents of deviant behaviour. These are typically very labour intensive and consequently expensive exercises to undertake and so they rarely cover long periods of time nor very many stores. But, if undertaken utilising robust methods, they can provide a useful snapshot of what the losses associated with Fixed SCO are, which can then be used to estimate the overall losses for the business.
While this study has been able to draw upon case-studies where all of these methods have been used, it has not always been possible to fully verify the efficacy of all the data points provided – few companies were prepared to share raw data. In a number of circumstances, the data was not considered sufficiently robust and a decision was taken to exclude it from the study.
Scan and Go/Mobile SCO Systems
In contrast to Fixed SCO, these systems do provide more concrete opportunities to collect data points, primarily from the audits carried out on users, which can then be used to estimate the losses associated with them. The following data points were collected:
With and Without Studies: as with Fixed SCO, some companies were able to compare rates of loss between stores that were utilising this technology compared with those that were not.
Partial Audit Data: the following range of data points were made available by some of the participating companies, based upon 140 million Scan and Go transactions and 17 million transaction audits:
Total number of company transactions
- Total value of company transactions
- Total number of Scan and Go transactions
- Total value of Scan and Go transactions
- Total number of Scan and Go audits undertaken
- Total value of Scan and Go transactions audited
- Total number of Scan and Go audits where at least one error was found
- Total value of errors found in failed audits
- Total number of items found to have been under-scanned in failed audits
- Total value of items found to have been under-scanned in failed audits
- Total number of items found to have been over-scanned in failed audits
- Total value of items found to have been over-scanned in failed audits
Full Audit Data: one company was able to provide data on nearly 20,000 full random audits that they had completed on their Scan and Go SCO users, which included, the data on the audit error rate and the size of the basket (number of items).
Non-scanned Product Lists: several companies were able to provide data on the type, quantity and value of items that had been found not to have been scanned when audits were being undertaken. An analysis was undertaken from a list of 486,000 items, equating to 52,000 SKUs collected over a 12-month period by one company
The Collecting of Qualitative Data
Interviews were carried out with representatives from the 13 retail companies taking part in this study, including senior managers responsible for the planning, introduction and management of SCO systems; those with responsibility for loss prevention; and members of store teams where the systems were in use. In addition, interviews were carried out with senior managers in two of the major providers of SCO technologies, who were asked about the ways in which they were supporting retailers and developing technologies to better manage SCO-related risks. Most, but not all interviews took place at either the headquarters of the organisations agreeing to take part or in their retail stores. Interviews typically lasted between 60 and 120 minutes and in total 73 people took part in this process, generating over 50 hours of taped interviews, which were subsequently transcribed.
In addition to the interviews, visits were made to 11 retail stores where SCO was in operation (mostly hosted by representatives from the case-study companies). This provided the opportunity to spend time looking at the SCO practices and process currently in place, observing both SCO users and SCO supervisors, where possible talking informally with the latter about their experiences of managing these systems. In addition, a number of SCO shopping journeys employing known SCO scams were undertaken to better understand how SCO supervisors and SCO systems reacted to these events. This included all three types of SCO system under consideration in this study: Scan and Go/Mobile SCO and Fixed SCO. No attempt was made to try and systematically record the outcome of these shopping journeys – they were simply an opportunity to gain firsthand experience of how SCO scamming can happen and how they may or may not be detected by Supervisors and SCO systems.
Confidentiality and Presentation of Data
Throughout this report, direct quotations are provided from the transcripts of interviews carried out with a range of representatives from the companies taking part in this research. Each quotation has been given an identifying case-study number, but due to the relatively small number of companies taking part and to avoid any particular respondent being identified across multiple quotations, this identifier has been changed for each section of the report. So, for instance, code R1 refers to a different company in each of the sections in the report (where interviews were carried out with multiple people present, all subsequent quotes are referred to as the same company). Where respondents have provided quantitative data, this has also been anonymised and checked with the companies that agreed to take part. Where currency exchange has been necessary, the prevailing rate on the 19th July 2018 has been used (25).
Limitations
As with any research, there are limitations in what can be achieved and presented and the case-study selection process needs to be considered when reviewing the findings. As detailed in the body of the Report, getting accurate and reliable data on the impact of SCO systems on retail losses has been extremely challenging indeed – the paucity of data in retail companies is as revealing a finding as the actual data on losses itself. Because of this, caution needs to be observed when interpreting the data presented in this report, particularly that relating to Fixed SCO systems, where measurement challenges are especially acute. In particular, where companies have provided comparative store data, it has proved challenging to ensure that any identified differences can be accurately associated with the use of SCO technologies rather than other systematic differences between the samples of stores analysed. In addition, some of the Scan and Go data has reliability issues as well, not least in the estimates of what percentage of SCO errors are under-scans versus over-scans. Some of the data collected from Partial Re-scan Audit data, because of the nature of the process, will rarely accurately capture over-scans – the Audit Supervisor is highly unlikely to notice these events unless they have first identified an under-scan. As such, the reader needs to recognise these limitations when reviewing the findings from this research.
Notes
- Throughout this report the acronym SCO will be used to refer to all forms of self-checkout and pay technologies – a more detailed description of each of these can be found in the Section titled Background.
- While there is little consensus across retailing on what the term ‘shrinkage’ means, for the purpose of this study, and the way in which retail loss data was collected from participating retailers, it will be used to describe only the losses captured by retailers through periodic stock audits. See the following for a review of this issue: Beck, A. (2017) ‘Reconceptualising Loss in Retailing: Calling Time on ‘Shrinkage’, The International Review of Retail, Distribution and Consumer Research, 27 (4): 407-423.
- This is based upon a study completed by ECR in 2014 which found that the average rate of shrinkage across the case-study companies was 0.67% of retail sales: Beck, A. and Bornman, M. (2014) Making the Link: The Role of Employee Engagement in Controlling Retail Losses, An ECR Europe White Paper, Brussels: ECR Europe.
- Research by Kiosk Market Place estimated that the global self-service market would reach $21.1 billion in 2017, growing by 15.8%, with retail being a major area of expansion: Slawsky, R. (2017) Opportunities for Self-service Technology in 2017, Kiosk Market Place. In addition, see: O’Shea, D. (2017) ‘Shipments of self-checkout terminals hit record in 2016’, Retail Drive, https://www.retaildive.com/news/shipments-of-selfcheckout-terminals-hit-record-in-2016/446664/.
- See: Uncles, D. (2006) ‘Understanding Retail Customers’ in K. Manfred and M. Mantrala (Eds) Retailing in the 21th Century: Current and Future Trends, Berlin: Springer, 205-219; Orel. F. and Kara, A. (2014) ‘Supermarket self-checkout service quality, customer satisfaction, and loyalty: Empirical evidence from an emerging market’, Journal of Retailing and Consumer Services, 21 (2): 118-129.
- See Cameron, M.O. (1964) The Booster and the Snitch. New York: Free Press of Glencoe, Collier Macmillan; Curtis, B. (1983) Retail Security: Controlling Loss for Profit. Boston: Butterworths.
- See for instance: FierceRetail (2018) Self-Checkout making it much harder to prosecute shoplifting, https://www.fierceretail.com/operations/selfcheckout-making-it-much-harder-to-prosecute-shoplifting.
- A number of retailers have now opened stores where the only option is to use self-checkout technologies, for instance, Ahold in the Netherlands and some Tesco stores in the UK.
- Because of the many similarities between Scan and Go SCO and Mobile Scan and Go SCO systems, and the approaches being adopted to try and control the losses associated with them, they may be combined and described as Scan and Go/Mobile SCO systems or technologies.
- See for instance: http://supersmart.co.il; and the following article about the same technology: https://www.timesofisrael.com/checkout-app-byisraels-supersmart-follows-amazon-gos-lead/. For a review of current RFID technologies see: Beck, A. (2018) Measuring the Impact of RFID in Retailing: Key Lessons from 10 Case-study Companies, ECR Community: Brussels.
- Harris, M. (2018) ‘Amazon Go: Convenience and Concern at New Checkout-free Corner Shop’, The Guardian, 22th January.
- See: Litfin, T. and Wolfram, G. (2006) ‘New Automated Checkout Systems’ in K. Manfred and M. Mantrala (Eds) Retailing in the 21th Century: Current and Future Trends, Berlin: Springer, 143-158.
- See for instance, Clarke, R.V. (1980) ‘Situational Crime Prevention: Theory and Practice’, British Journal of Criminology, 20; 136-147.
- Retailers can influence the degree of benefit a would-be offender might gain from the theft: see: Hayes, R. (2012) ‘You Can Steal it, But You Can’t Use It: Moving Toward Benefit-Denial Technology’, LPPortal.Com, September-October, pp. 39-46.
- Beck and Bornman (2014) op cit.
- Sweethearting is the term used by the retail industry to describe incidents where checkout operators will selectively not scan items for people that they know, such as family and friends.
- See Beck (2017) op cit.
- The two main companies currently providing this technology are Stoplift: https://www.stoplift.com, and Everseen: https://www.everseen.com.
- Jeffery, C.R. (1977) Crime Prevention Through Environmental Design. 2nd Edition edn. Beverly Hills: Sage.
- Waitrose in the UK have been the focus of a number of newspaper articles highlighting disgruntled customers who were not expecting to be subjected to an Audit, and when they were, reacted very badly: Smithers, R. (2018) Why was I humiliated by Waitrose self-scan check?, The Guardian, 23th January: http://www.theguardian.com/money/2018/jan/23/waitrose-quick-check-rescan-security. In this instance, Waitrose contacted the disgruntled reader to ‘apologise’ with a goodwill gesture, which arguably, is creating a dangerous precedence for all future audits.
- Retailers are also looking at how they can communicate with consumers via the app for commercial as well as security issues: Pekic, B. (2015) ‘Portugal’s Jumbo Launches Indoor Proximity App’, European Supermarket Magazine, 15th December, https://www.esmmagazine.com/portugalsjumbo-launches-indoor-proximity-app/22200; IGD (2016) Albert Heijn to Go app to target shoppers...’, IGD Retail Analysis, https://retailanalysis.igd. com/news/news-article/t/albert-heijn-builds-online-and-digital-scale/i/11398.’
- See: Beck, A. (2007) Effective Retail Loss Prevention: 10 Ways to Keep Shrinkage Low, Leicester: University of Leicester; Beck, A. with Peacock, C. (2009) New Loss Prevention: Redefining Shrinkage Management, Basingstoke: Palgrave Macmillan.
- For instance, awareness of senior management about some of the concerns associated with SCO can be seen in recent comments by the CEO at Tesco, who raised concerns about the risk of increased losses due to introducing Mobile Scan and Go SCO: http://www.gizmodo.co.uk/2018/06/ tesco-tests-cashless-checkouts-and-mobile-self-scanning/.
- A further possible way of measuring the impact of Fixed SCO machines is to undertake Before and After Studies: measuring rates of loss prior to the installation of fixed SCO systems and then measuring them after they have been running for a period of time.
- The exchange rate used was provided by: http://www.xe.com/currencyconverter/


Main office
ECR Community a.s.b.l
Upcoming Meetings
Join Our Mailing List
Subscribe© 2023 ECR Retails Loss. All Rights Reserved|Privacy Policy