


Improving Employee Engagement to Reduce Retail Loss
How improving engagement in just the bottom quartile of stores can reduce unknown loss (shrink) by 12.5%
Table of Contents:
- Abstract
- Introduction
- - Understanding Retail Losses
- - The Role of People in Retailing
- - Methodology
- Key Findings
- - Overall Levels of Total Loss
- - Employee Engagement and Total Loss
- - Loss Indicators and Employee Engagement
- - Employee Engagement and Waste
- - Employee Engagement and Out-of-Stocks
- - Employee Engagement and Unknown Loss (Shrinkage)
- - Loss Indicators and Store Performance
- Implications and Recommendations
- - Loss Prevention and Employee Engagement
- - Pivotal Role of Managers
- - Putting People First
- - Next Steps for Retailers
Languages :
This report explores the link between levels of employee engagement, measured across 18 factors, and four indicators of retail loss: shrinkage, waste, cash loss, and lost sales driven by out of stocks. It is based upon questionnaires from more than 200,000 members of staff in three large European retailers with a combined turnover of over €35 billion and 1,570 stores.
The research found that a significant number of employee engagement factors were found to be linked with the four loss indicators – 15 of the 18 Factors were associated with loss. It is also concluded that by improving performance on just 6 key engagement factors in the bottom 25% of stores to the average found in the rest of the business, the European Grocery sector could save as much as €380 million a year. More specifically, by targeting only the bottom quartile of stores, the research found that the following savings could be made: 9.8% reduction in waste; 19.6% reduction in lost profits through out of stocks; 12.5% reduction in shrinkage; and a 9.5% reduction in cash loss.
The study also highlighted the key role store managers can play in delivering many of the most important engagement factors driving potential reductions in store losses: communicating effectively; making staff feel appreciated and valued; building good teamwork; ensuring staff roles are manageable; providing opportunities for staff development; and taking seriously ideas offered by their staff.
The research study concluded that retailers should: recognise the value of targeting employee engagement, particularly in the bottom quartile of stores in their business; review the selection process for store management and applicants’ capacity to deliver on employee engagement; incorporate these results into training programmes for store managers; think about how the business communicates change to its employees; provide ways for staff to feed back ideas for improving the way the business operates; consider ways in which employees can be given opportunities for future development within the business; reward good performance, even if it is only a ‘thank you’; consider either utilising Employee Engagement surveys or re-analysing existing survey data to consider potential links between staff responses and a range of loss indicators; and reflect upon how retail measures loss and whether current strategies and prioritises are targeting the most pressing areas.
Finally, the report surmised that while the role of well-motivated and engaged staff play in helping to sell more has previously been identified, this new evidence also shows that staff can play a pivotal role in enabling retail companies to lose less.
Abstract
This report explores the link between levels of employee engagement, measured across 18 factors, and four indicators of retail loss: shrinkage, waste, cash loss, and lost sales driven by out of stocks. It is based upon questionnaires from more than 200,000 members of staff in three large European retailers with a combined turnover of over €35 billion and 1,570 stores.
The research found that a significant number of employee engagement factors were found to be linked with the four loss indicators – 15 of the 18 Factors were associated with loss. It is also concluded that by improving performance on just 6 key engagement factors in the bottom 25% of stores to the average found in the rest of the business, the European Grocery sector could save as much as €380 million a year. More specifically, by targeting only the bottom quartile of stores, the research found that the following savings could be made: 9.8% reduction in waste; 19.6% reduction in lost profits through out of stocks; 12.5% reduction in shrinkage; and a 9.5% reduction in cash loss.
The study also highlighted the key role store managers can play in delivering many of the most important engagement factors driving potential reductions in store losses: communicating effectively; making staff feel appreciated and valued; building good teamwork; ensuring staff roles are manageable; providing opportunities for staff development; and taking seriously ideas offered by their staff.
The research study concluded that retailers should: recognise the value of targeting employee engagement, particularly in the bottom quartile of stores in their business; review the selection process for store management and applicants’ capacity to deliver on employee engagement; incorporate these results into training programmes for store managers; think about how the business communicates change to its employees; provide ways for staff to feed back ideas for improving the way the business operates; consider ways in which employees can be given opportunities for future development within the business; reward good performance, even if it is only a ‘thank you’; consider either utilising Employee Engagement surveys or re-analysing existing survey data to consider potential links between staff responses and a range of loss indicators; and reflect upon how retail measures loss and whether current strategies and prioritises are targeting the most pressing areas.
Finally, the report surmised that while the role of well-motivated and engaged staff play in helping to sell more has previously been identified, this new evidence also shows that staff can play a pivotal role in enabling retail companies to lose less.
Introduction
Retailing is big business – it has become not only a cornerstone of how we define and measure economic prosperity in most countries around the world, it increasingly shapes and defines the cultural identity of modern societies. For many people shopping has moved far beyond merely a function of accruing things we need to survive to being an embedded and defining constituent part of human development – for many people what we own and consume defines the narrative of billions of lives around the world. As an industry, retailing is characterised by change and evolution – it drives its success through constantly reimagining what will attract the consumer to the burgeoning cathedrals of consumerism, many of which are moving from the traditional bricks and mortar setting into the realms of cyber space. Those retailers that evolve and adapt the best, that constantly challenge the way in which they meet and shape the consumer market, and seek out new ways of delivering consumer ‘satisfaction’, will succeed. Those that do not are unlikely to prosper – the pace of change and the increasing pressure from ever more voracious competitors will see to that. A key priority for retailers is how to most effectively manage their businesses – how to not only drive sales but also control costs, in particular the losses they generate, and the people they employ to meet the needs of their customers.
For the majority of retailers some form of loss is an inevitable part of doing business – it is a regrettable yet inevitable part of the retail landscape. What form this loss takes and critically how much it costs the business varies enormously depending upon the type of retailer and the quality of their operations. Supermarkets for instance are much more likely to generate larger losses than say an antique shop – the former has all the difficulties of scale and a wide array of products with a finite shelf life, while for the latter, in some cases the older the product gets, the more it might actually increase in value! In addition, the customer experience is often heavily dependent upon the way in which retail employees behave and deliver an organisation’s culture and ethos – they are often the most visible and defining representation of the business. While some organisations have purposefully sought to drive a wedge between the terms ‘service’ and ‘customer’, such as some of the low cost airlines operating in Europe, for the most part the majority of retail organisations recognise that the people they employ can have a profound impact upon how their business is perceived and experienced. In turn, the extent to which retail employees feel valued, rewarded and are offered meaningful opportunities by the business that employs them is a key component in delivering customer service – it is highly likely that unhappy, demotivated and disengaged staff are much less inclined to deliver great customer service than those that find their work to be enjoyable, rewarding and fulfilling.
The purpose of this report is to examine these two elements and assess whether and to what extent they are linked. What impact does the way in which retail employees view their work-life experience have upon the levels of loss experienced by their business? Is it the case that levels of loss are higher when levels of staff engagement are low and vice versa? As will be detailed below, this is potentially a very important avenue of investigation as retail losses in some instances can be equivalent to the overall profitability of a business – research has shown that reducing rates of loss by 25% could grow overall profitability by 15% (1) . In addition, the significant role poor operational adherence plays in creating loss has now been clearly identified and how better design and delivery of retail processes and procedures can deliver significant benefits (2) . Crucial to this, of course, are the people tasked to design, monitor and deliver them.

Based upon the first detailed analysis of both a range of store-based indicators of loss and levels of employee engagement across three major European retailers, this report provides a unique insight into the complex interrelationship between retail losses and employee engagement. The first part of the report maps out what is currently understood about loss in the retail sector and how it is defined and measured. It is then followed by a brief review of the research on the role employees can play in delivering successful retailing. The report will then explain the methodology used before going on to present the findings from the research. It will end with some conclusions and recommendations on how this research might be used by the retail community.
Understanding Retail Losses
Despite having a potential global price tag of at least €208 billion a year the retail industry has yet to agree upon a common definition of what constitutes loss within their sector (3) . While the terms ‘shrinkage’ and ‘shrink’ are widely used to describe some of the losses suffered by retailers (4) , few agree on what is included or excluded from these terms or how these losses should be measured and recorded. This lack of clarity inevitably shrouds any attempts to undertake benchmarking exercises in a veil of retail fog, with numerous annual surveys (5) inevitably being more about opinion than fact. It is worth therefore clarifying what we know to date and outlining how this report intends to address the issue of loss.
Usage of the word ‘shrinkage’ can be found as early as the 1860s to describe inaccuracies in inventory although later accounts have described it as ‘the difference between book inventory and actual physical inventory as determined by the process of taking one’s inventory of goods on hand’, and ‘the amount of merchandise that disappears due to internal theft, shoplifting, damage, mis-weighing or mis-measuring and paperwork errors’ (6) . More recently, Chapman and Templar developed a much broader definition: ‘intended sales income that was not and cannot be realised’, which has been largely accepted by the ECR Europe Shrinkage Group (7) . Most published typologies of shrinkage tend to focus upon four categories of loss: external theft (shoplifting or shop theft); internal theft (employee theft); administrative error (process failures); and inter company fraud (supplier/vendor fraud) although few explain in any detail what each of these actually mean, especially when it comes to administrative error/process failures (8) .
The picture is further clouded when it comes to deciding whether known and unknown losses should be included in the shrinkage definition. For some retail organisations known losses, such as product going out of date, price markdowns, damaged products and any other losses that can be directly measured are excluded from their definition of shrinkage and recorded elsewhere. Unknown losses, as the name implies relates to those losses where the cause is not known and are mainly identified when organisations undertake regular stock audits and realise that there are differences between what the book stock suggests should be in a store and what an actual physical count of the stock identifies. The difference between the two numbers is considered by some to be ‘shrinkage’ (9) . For some types of retailer, in particular those involved in the selling of fresh food, including or excluding ‘known losses’ within their shrinkage figure will have a profound impact upon its overall size and cost – its inclusion probably causing the overall number to more than double in size.
Given this lack of consensus on what constitutes shrinkage it is perhaps surprising then that generally speaking most research and annual surveys have coalesced around a single method of measuring the value of losses – as a percentage of overall sales. So for instance the annual National Retail Security Survey carried out in the US concludes that the cost of shrinkage (based upon their definition of the term) amounts to 1.49%, while the Global Retail Theft Barometer (GRTB), which was a annual survey covering 44 countries, concluded that in 2011 globally retailers were losing 1.45% of total sales per year due to shrinkage (10) . Certainly other measures exist and are used by some retailers in certain circumstances (such as valuing losses at purchase price rather than sales price, or using the transfer cost or cost plus method which is the value determined by the purchase price plus an additional amount to cover the cost of handling the product (such as labour costs, storage costs etc)), but for the most part surveys and other benchmarking exercises have mainly generated a shrinkage figure based upon losses as a percentage of sales.
However, this is not always a good measure of the total cost of loss to the retail business as it excludes a number of consequential losses, some of which can generate significant costs. For instance, the link between out of stocks (OOS) and shrinkage is now recognised and could be generating annual global losses of sales in the region of $92 billion (11) . In addition, it generally excludes the myriad of other indirect costs attributed to the problem of shrinkage, such as extra shipment costs to cover those items that have been lost, damaged or stolen and the staff costs of handling them. Indeed, new forms of retailing, such as home delivery and associated customer guarantee arrangements whereby a retailer will supply an equivalent or more expensive item to ensure the order is complete, need to be taken into account and further muddy the existing definitions of shrinkage and loss.
Defining Loss
As detailed in the methodology section, this study is based upon data made available by three major European retailers who agreed to take part in this study. The study was interested in capturing more than just the cost of shrinkage and how this might be affected by rates of employee engagement – as mentioned above, retail businesses regularly incur other significant losses and so it was decided to, where possible, include some of these within this study. Throughout this study the term ‘Total Loss’ will be used to represent the overall cost of a basket of ‘loss indicators’ made up of shrinkage, wastage, cash losses and the cost of lost sales due to products being out of stock. How these are defined and measured are detailed in the subsequent section on methodology but it is important to note that their inclusion is based exclusively upon availability of data from the participating retailers rather than an attempt to offer a new definition of loss within retailing.
The Role of People in Retailing
From restocking shelves to serving customers and selling products, employees play an active and essential role in the daily functioning of a retail organisation. Despite this, they are often portrayed as a drain on business profitability, either through the direct costs of wages and associated employee benefits or as generators of loss, through malicious and non-malicious behaviour. However, although little work has been done to understand the link between overall employee engagement and the generation of retail losses, much more is known about their potential impact upon retail sales and customer satisfaction (12) . While previous research has generated a very mixed picture on the relationship between employee engagement and improved business profitability, some research has shown that the relationship is generally positive and beneficial to the business. For instance, research with a US grocer found that positive employee attitude was linked with improved customer satisfaction, which in turn was associated with improved sales performance (13) . The study found that each percentage point increase in customer satisfaction led to a 10% increase in sales in the following 12 months and that each percentage increase in employee satisfaction led to a 1.3% increase in overall sales.

Other research has found similar findings although some have found that a minimum level of staff and customer satisfaction has to be reached and maintained for a given period of time before there is any impact upon sales (14) . In addition, this research found that managers should have a solid understanding of the relationship between thresholds of satisfaction and engagement and their impact on sales in order to benefit from this causal relationship. Of particular interest to this study, it was also found that on shelf availability was positively associated with customer satisfaction. The important role the manager can play in affecting levels of employee engagement have been highlighted by a number of studies in particular the way in which levels of trust, store culture and atmosphere can affect levels of employee stress and anxiety. Similarly, it has been found that managers over prioritising productivity and sales can also have a negative impact upon levels of employee engagement, which in turn can negatively impact upon the customer experience (15) . Furthermore, it has been found that dissatisfied employees are more likely to steal from an organisation whereas satisfied employees are more likely to exhibit prosocial behaviour (16) . By no means does all the published research to date conclude that the link between staff engagement and productivity is clear and positive – meta analysis by several groups of academics have found either very weak or no correlations whatsoever, although they do cut across different times and types of businesses (17) .
Other than the work linking levels of theft with employee engagement no studies have been carried out to date exploring the broader relationship between a range of types of loss and levels of employee engagement, in particular rates of shrinkage, out of stocks, cash loss, and rates of waste. But what is clear from some of the existing research is that employee engagement can be one of the component parts of retailers generating sales and profit – more engaged staff are more likely to offer a better customer experience and this in turn is more likely to generate improved sales – a virtuous circle of engagement and financial success.
Methodology
Undertaking research on levels of loss in retail organisations is not easy – much if not all of the data is usually regarded as highly sensitive and confidential. This is even more so when data is required at the store level. Similarly, data on levels of employee engagement within retail companies is rarely if ever published – as with data on shrinkage and loss, it is regarded as commercially sensitive and not to be shared beyond the organisation collecting the information. In order for the proposed research to go ahead the researchers needed access to both sets of data – shrinkage and other loss indicators and rates of employee engagement, all at the store level. In order to achieve this, the ECR Europe Shrinkage Group, a collaborative body representing retailers and manufacturers across Europe, agreed to approach its members to seek volunteer-companies to take part in the research. Eventually three of the largest retail companies in Europe agreed to take part; collectively they have sales of over €35 billion a year and collect employee engagement data from 203,000 staff in 1,574 stores. All three were predominantly food retailers although they also sell a range of other household and consumer goods – two are based in the UK while the third is situated in mainland Europe. None wish to be identified as part of this research.
Defining Terms
As detailed earlier, few retailers use the same definition of shrinkage or adopt standardised measures of other forms of loss and this was the case with the three retailers taking part in this study. In addition, they each had a different set of questions they used to collect a broad range of information relating to employee engagement. The challenge was therefore to ensure that the data collected from the case study companies could be combined into a single data set without undermining the overall quality and validity of the original data. Inevitably this meant that only data that was consistent and available across at least two of the three retailers could be used.
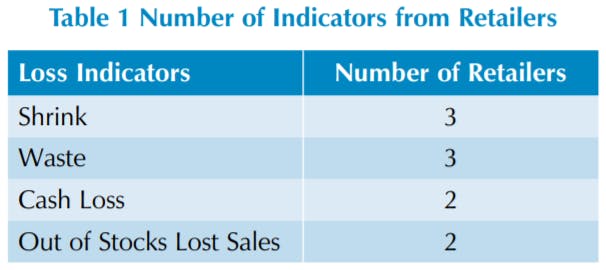
As can be seen from Table 1, not all the retailers were able to provide the variables at store level – the rate of shrinkage and waste, expressed as a percentage of sales, and the sales data were available for all three retailers. However, the level of out of stocks (expressed as a percentage of stock not available) and levels of cash loss (as a percentage of sales) were only available from two retailers. In order to generate overall levels of loss (and potential savings), where data is missing for a given retailer, the overall average for the other participating retailers has been used.
In order to ensure consistency in the data from each retailer, the following definitions were used for each loss indicator:
- Shrinkage: all unknown loss excluding recorded cash loss, waste, refund frauds and damage, expressed as a percentage of sales.
- Waste: the cost of dumping product which had gone beyond its sell by date, or the value of reducing the price in order to encourage a sale prior to this date, expressed as a percentage of sales.
- Out of Stocks: the percentage of stock not available on the shelf.
- Cash Loss: value of cash lost in a store expressed as a percentage of sales.
As with most data sets provided by third party organisations, it is not always possible to have absolute confidence in the methods used to collect the data – while detailed definitions of the various terms used were provided and every effort made to verify the extent to which the participating companies’ data met the required criteria, it is possible that differences may well exist in what has been included and how the data has been collected. For instance, one of the retailers did not include ‘dumped’ (product thrown away) in their waste statistic. However, because correlations are being drawn between satisfaction data and loss data at the store level and not between retail companies, this variance is not thought to be significant.
All of the data was provided in spreadsheet format with the exception of one retailer who was only able to provide their employee engagement data in a paper format, which was subsequently manually inputted by the researchers. All of the data covers the calendar year 2012 and the employee engagement data from all three participating retailers was based only upon the average positive score from all employees completing a questionnaire in a given store.
Developing Comparable Engagement Factors
Because each organisation used a unique employee engagement survey, utilising a slightly different number and set of questions, it was necessary to develop a common set of questions in order to make any analysis possible. Retailer one had 38 questions in their survey, Retailer two had 30 questions and Retailer three had 42 questions. Thus the total number of unique employee engagement questions was 110. However, all three surveys covered very similar areas of enquiry and so it was possible to group the questions into broad overarching areas and produce a combined score for the composite variable. For instance, Table 2 below shows how 5 original questions were combined to create a new variable which, it is argued, encapsulates the meaning of the original questions.
Eventually through a process of combination and reassignment the three surveys were combined into a single set of 18 overarching employee engagement questions as detailed in Table 3.
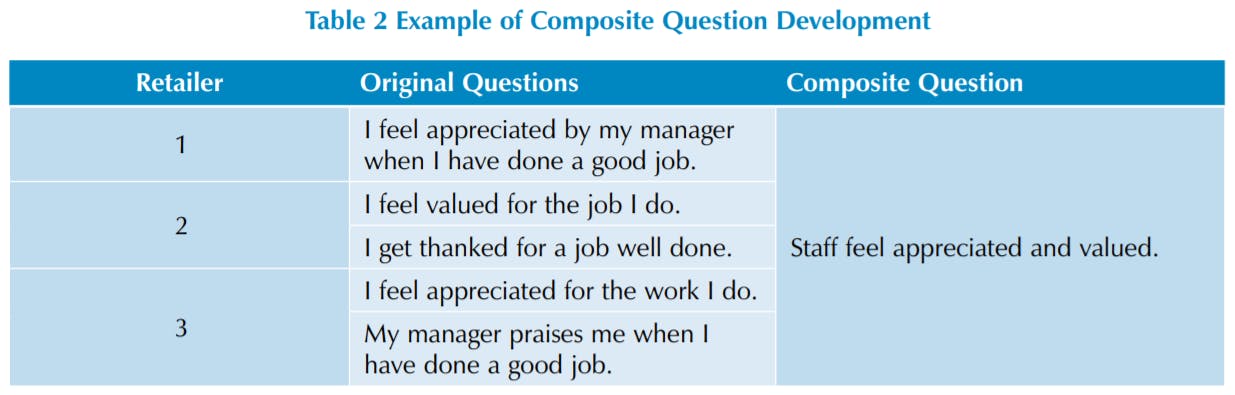
Table 3 - Combined Employee Engagement Questions
- Staff and managers look to improve customer service.
- Staff believe that their ideas and suggestions are taken seriously.
- Staff believe there are good opportunities for development.
- Staff feel motivated to go beyond what is normally expected of them.
- Staff feel they have the opportunity to improve the way things are done.
- Staff feel there is good teamwork in the business.
- All staff have the information, training, tools and equipment to do their job well.
- Staff feel they are fairly rewarded for the work they do.
- Staff feel they are treated fairly and with respect.
- Staff feel their job is manageable and satisfying.
- Company provides a safe and tolerant working environment.
- Staff feel appreciated and valued.
- Managers communicate effectively with staff about performance and objectives.
- Manager/Company is good at keeping us informed about what is going on in the company.
- Manager trusts staff to get on with their job.
- Staff think their manager is effective.
- Staff are happy to recommend the company.
- Staff express loyalty towards the organisation.
The full set of original questions and how they were combined to create the 18 questions above can be found in Appendix A. For each of the new questions a combined score was calculated showing the overall percentage of staff in each store that agreed with the statement.
These 18 questions were then further divided into four perception-based categories: Contribution, Environment, Management and Organisation. These are defined as:
Staff Perception of Contribution: questions relating to the way in which staff feel they contribute to the organisation, whether their contribution – such as ideas or suggestions – are taken seriously and whether they have the opportunity to contribute to improving processes and customer service. This category looks at the way staff perceive whether their role in the organisation adds value and is important.
Staff Perception of Environment: questions examining staff perceptions of their immediate environment within the organisation and store, including whether staff feel they have all the resources they need to do their job well, they are treated fairly and with respect, they feel satisfied with their job and the environment where they work is a safe and tolerant place.
Staff Perception of Management: questions on management including whether staff believe there is effective communication from management about performance, objectives and new developments within the organisation. This area also includes perceptions of whether staff feel their manager values, appreciates and trusts them.
Staff Perception of Organisation: questions on loyalty to the organisation and whether staff would be happy to recommend the company.
Making Sense of the Data
Where appropriate, the data has been used to extrapolate statistics for the Grocery sector (18) as a whole in Europe. The definition of Europe covers 45 countries (19) and the total used is derived from all retail sales for this channel for 2012 (€814.5 billion (20)). Clearly this data needs to be treated with some caution as the estimates are based upon data from only 3 retail companies. All the data presented in this report are weighted to take account of the annual sales turnover of each store included in the study, which varied between a high of €159 million and a low of €1.1 million.

Calculating actual losses generated by out of stocks (OOS) is not easy – previous research has shown that anticipating the likely outcome of an OOS situation on customer behaviour is highly complex and affected by a whole host of factors including product type, current promotions, customer profile, and the surrounding retail environment. In addition, unlike the other loss indicators used in this study, retail margin needs to be taken into account before comparisons can be drawn between the various loss indicators. The data presented below and throughout this report relating to OOS losses is premised upon two assumptions to try and take account of these factors. The first makes use of the research undertaken in 2002 by Corsten and Gruen, which found that globally 49% of total OOS led to actual lost sales (21). The second relates to retail margin and is based upon estimates by the Financial Times (22) and retail representatives of the ECR Europe Shrinkage and On-shelf Availability Group. While difficult to achieve consensus on how best to take account of retail margin on calculating the actual loss caused by OOS this report will use a compensatory figure based upon an average gross margin of 30%. In this data set the overall average rate of OOS was 5.31%, which when the Corsten and Gruen readjustment is used (49% of OOS lead to a lost sale) generates a loss figure of 2.6%. This is then further revised to take account of the proposed average retailer gross margin (30%), which generates a OOS loss figure of 0.78%. The authors believe that this much more conservative estimation of the actual cost of OOS, which takes account of both customer reactions to OOS and recognition of gross margin enables justifiable and sensible comparisons to be drawn between the different loss indicators. Throughout the remainder of this report the term ‘out of stocks’ (OOS) will be used to refer to this revised indicator of the actual cost of lost sales due to out of stocks.
Given that the focus of this report is to explore whether there is a relationship between levels of employee engagement and a range of store-based loss indicators, statistical analysis has been performed to consider firstly the degree to which there is correlation between variables and secondly whether the variance in a given variable can be explained by one or more explanatory variables. For example, is the rate of shrinkage associated with say the degree to which staff think their manager does a good job – does shrinkage decrease in line with increases in staff perceptions of their manager (in this case a negative correlation – as one variable decreases (the rate of shrinkage) another increases (the levels of employee engagement))? Within this report the Pearson Product-moment Correlation Coefficient has been used to determine the degree of association between two variables, which generates a measure of association ranging from -1 to 1 and uses a confidence level of 0.05%.
To measure the extent to which variation in a given variable can be explained by other associated variables, Multiple Linear Regression analysis was used. This seeks to calculate the extent to which a group of variables can explain the variance in another related variable expressed as a percentage (determined by the R2 score). For example, to what extent can the range of variables associated with say employees’ views of their managers (there are 5 variables) explain the variance in levels of store waste? This can be expressed as a percentage of the variance in the waste score explained by these 5 variables using a confidence level of 0.05%. Clearly the efficacy of any regression module is predicated upon having all the possible variables available that might explain the difference in a variable, but this is rarely if ever possible (there could always be another variable we are not yet aware of that might explain the difference). It is important therefore to bear this in mind when reviewing the results presented below. In the results section below, each of the loss indicators will be considered and the engagement factors that were found to be correlated to them presented together with the extent to which these factors are able to explain the variance in any given loss indicator. It is worth noting that all estimates of the impact of changes in employee engagement for any given loss indicator within this report take account of the explanatory power of any given combination of factors.
Measuring Impact
As will be detailed below, this research has found a number of engagement factors that are associated with the various loss indicators and so it was important to think about how this data could be best presented to enable retailers to better understand the implications of these findings for their companies. After consultation with the ECR Europe Shrinkage and On-shelf Availability Group it was decided that the data should be organised in such a way that the performance of the bottom 25% of stores on any given loss indicator and associated engagement factors could be compared with the other 75% of stores. This then enabled a calculation to be made estimating what the overall saving might be were the bottom 25% of stores brought up to the average of the remaining 75% taking account of the explanatory power of the correlated satisfaction factors. This is a purposefully conservative approach to measuring the potential impact of any given set of employee engagement factors and arguably any measures brought in to improve employee engagement would be likely to have a positive impact across all stores.
Key Findings
Overall Levels of Total Loss
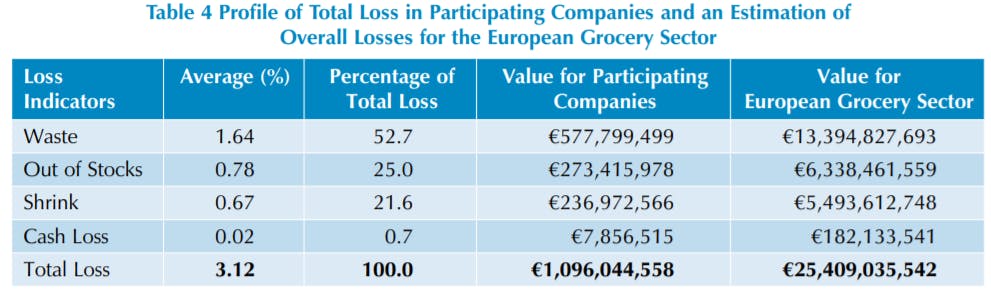
Detailed in Table 4 below is an overview of the average levels of loss experienced by the retailers taking part in this study together with an estimate of the overall costs for the total European grocery sector. Overall, the companies taking part in this study had a total loss that represented 3.12% of their total sales, amounting to just over €1 billion a year. If this rate of loss is representative of the grocery sector in Europe as a whole, then the losses amount to just over €25 billion a year.
As can be seen, in percentage terms, waste generates the largest amount of loss – accounting for 53% of all the losses experienced by the retailers taking part in this study. When weighted for store sales, this amounted to over €500 million in losses and if this is indicative of the rate across Europe, then the sector is ‘wasting’ over €13 billion a year. This is then followed by cost of lost sales generated by out of stocks – 0.78% of sales or €6.3 billion of losses for European Grocers. The ‘traditional’ measure of loss – shrinkage – is ranked third in terms of the total loss figure, accounting for 21.6% of total loss, generating for the participating retailers €237 million of losses and for the European Grocery Sector as a whole almost €5.5 billion in losses. The final loss indicator of cash loss represented a modest percentage of total loss – just 0.7% of the total but still amounting to over €180 million a year for European grocers.
This data is striking not least because of the distribution of losses, but also because other potential losses have not been included (through unavailability) which could further increase the actual cost of losses to the retail sector such as consequential losses incurred through the additional transportation and employee costs necessary to replace lost or damaged stock. What is particularly interesting is the inclusion of lost sales as consequence of out of stocks (OSS) – a measure rarely if ever included in a report focussed on retail losses. Its ranking in second place behind waste but ahead of shrinkage is intriguing, shedding light on not only a huge area of loss, but also an area that has enormous potential for impacting upon business profitability. Needless to say well established commentators and practitioners in asset protection will seek to dismiss this as not something that is or should be part of the remit of the Loss Prevention function, preferring to focus upon the malicious components of loss embedded within the shrinkage figure – loss prevention is about catching thieves not engaging in store operations. For some this may be their preferred avenue of activity, but the rapidly changing nature of the retail space, with new forms of retailing emerging almost on a daily basis, and customers beginning to behave more like highly informed traders than passive recipients of what retailers choose to offer them, requires all business functions to re-evaluate their role and priorities.
To tackle retail losses effectively requires a willingness to recognise the real size of the prize, to properly prioritise the ensuing business opportunities, to have clarity of purpose and to engage the business in achieving the goal of selling more and losing less. In many respects the term ‘shrinkage’ has become a confused and confusing term that offers a convenient hole within which to pour many and varied types of loss. It is arguably time to review its role within the world of retail losses and how it often fails to adequately capture not only what should be the focus of attention but also the factors that are having the greatest impact upon profitability.
Employee Engagement and Total Loss
For each of the stores taking part in this study a ‘total loss’ figure was calculated based upon an aggregation of the waste, cash loss, shrinkage and OOS data. Where a company was not able to provide one of these variables the average for the other companies was used to enable an overall total loss figure to be calculated that could be weighted to take account of the overall sales in each of the stores included in this study. This total loss number was then correlated with the 18 employee engagement factors, and those which were found to have an inverse relationship (i.e. statistically significant lower levels of total loss and higher levels of engagement), were then entered into a linear multiple regression model to understand the extent to which these variables could explain the variance in the total loss number.
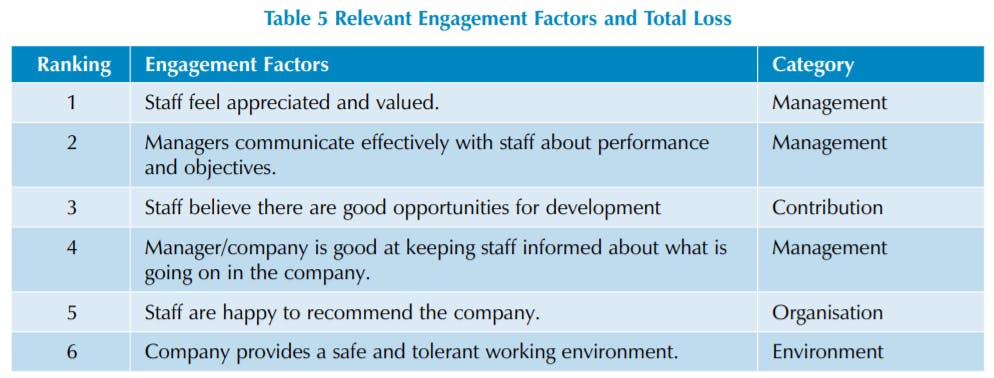
It was found that six employee engagement variables were correlated with total loss, which can be found in Table 5. Regression analysis showed that 21% of the variance in the total loss statistic could be explained by these six variables.
Of the six factors, three were from the Management category, with one each coming from the Contribution, Environment and Organisation categories. The most important factor was found to be the extent to which staff felt they were appreciated and valued by their managers, followed by how well they considered that their managers communicated with them about their performance and objectives. The third most important factor was the degree to which staff believed there were good opportunities for them to develop as employees, followed by their view on how well their manager and the company kept them informed about what was going on in the business.
The two final factors related to their willingness to recommend the company and how well the business performed in terms of creating a safe and tolerant working environment.
It is striking the extent to which the ‘manager’ features in this list of key employee engagement factors – not only in terms of ensuring that staff are given feedback which recognises their efforts but also as communicators not only of individual performance and activities, but also as a spokesperson for the business on future plans and priorities.
Detailed in Table 6 is an estimation of the potential impact of improving the performance of the bottom 25% of stores on these six engagement factors to that achieved on average by the remaining 75% of stores. In other words, what would be the revised rate of loss were the bottom 25% of stores to be performing at the same rate on these engagement factors as the other stores taking into account that the regression analysis found that they explained 21% of the variance in the total loss statistic.
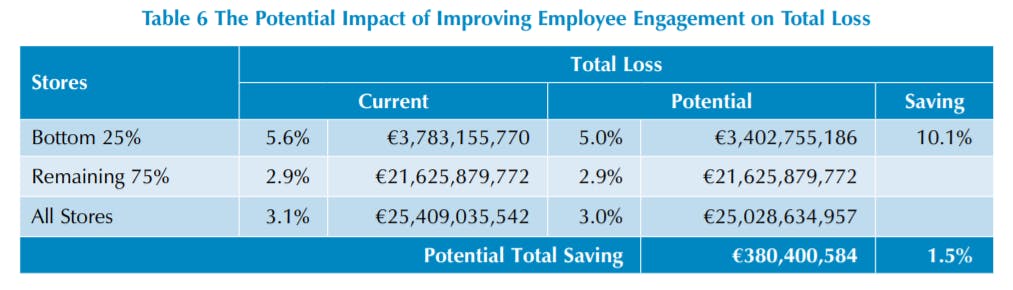
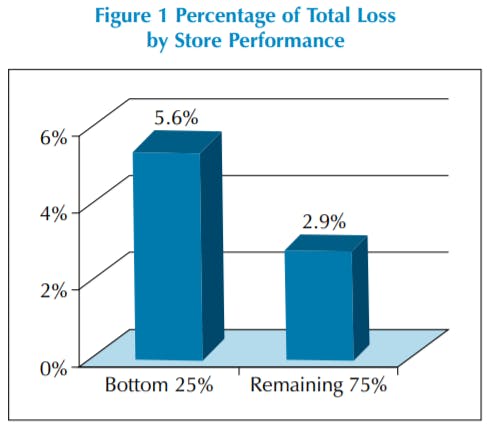
As can be seen in Figure 1 above, the rate of total loss in the bottom 25% of stores was 5.6% – 48% higher than the remaining 75% of stores. When used to calculate the total loss number for the European Grocery Sector, taking the overall average of 3.1%, this equates to an annual loss of just over €25 billion – equivalent to the combined GDP of Estonia and Albania. If the rate of employee engagement found on the six key factors in the top 75% could be achieved in the bottom 25% of stores, then this would lead to a reduction in loss of 10.1%. Overall, this would mean a saving of €380 million a year or a 1.5% reduction in total loss. This is a purposefully conservative estimate – it does not assume any improvement in the rate of engagement for the remaining 75% of stores. If a similar rate of improvement could be achieved amongst this group of stores as well, then the saving would be in the order of €2 billion a year.
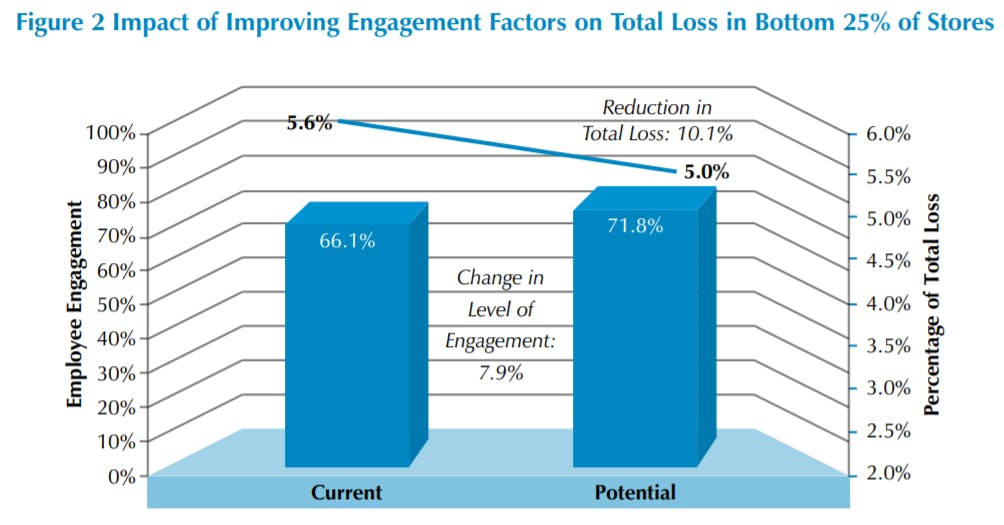
Figure 2 below summarises the overall impact these engagement factors could have on levels of total loss in the bottom 25% of stores and how much the overall average for each of the engagement factors would need to improve to be the same as those found in the remaining 75% of stores. The average rate of engagement for the bottom 25% of stores was 66.1% compared with 71.8% for the remaining 75% of stores. As can be seen, the engagement scores on the five factors would need to increase by just 7.9% for these stores to record a reduction of total loss by 10.1%.
Loss Indicators and Employee Engagement
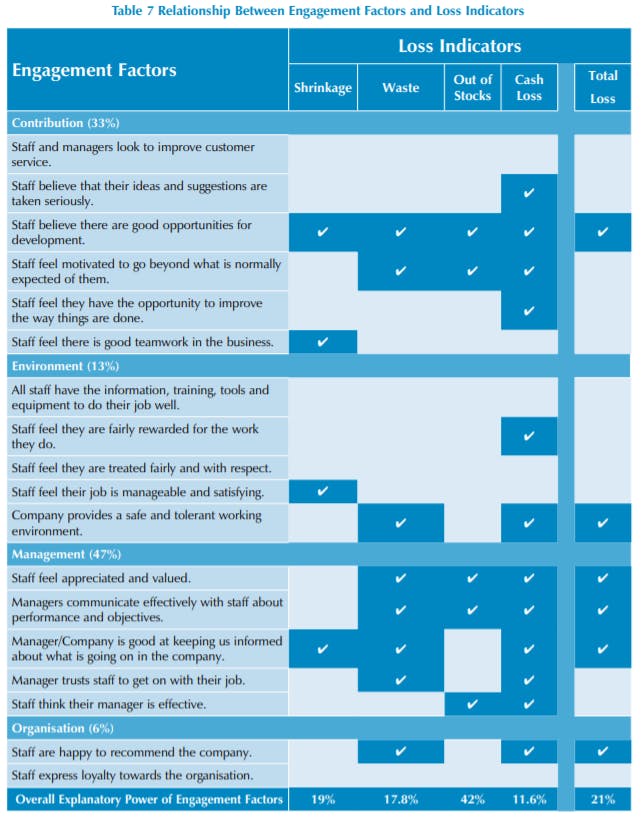
Detailed in Table 7 is a breakdown of the employee engagement factors that were found to be correlated with each of the loss indicators – waste, OOS, shrinkage and cash loss. Because different engagement factors were found to be correlated with different loss indicators, which in turn generated variation in their combined explanatory power (using regression analysis) these estimates will not aggregate to the total loss statistic presented in the previous section.
Table 7 brings together all the various engagement factors and how they relate to the loss indicators. In addition, it shows the overall percentage of factors relating to each of the loss indicators and the overall explanatory power they have.
As can be seen, the factors relating to the category of Management generated the largest number of correlations across the four loss indicators (47% of all correlations), with the extent to which staff feel appreciated and valued, the effectiveness of managers to communicate performance and objectives, and keeping staff informed about what is going on in the business being common across three of the four loss indicators. The second largest Engagement Factor in terms of the overall number of correlates was Contribution (33%). This factor brought together how staff felt about the way in which their role and responsibilities were viewed within the business. Of particular importance here was the extent to which staff felt there were good opportunities for personal development, which was a common factor across all four loss indicators. The third most important area was the way in which the employees viewed their Environment (13%) but none of these questions generated a unanimous response across all four-loss indicators. Finally, the two questions relating to the way in which staff viewed the Organisation accounted for only 6% of the total correlates – the extent to which staff were willing to recommend the company was seen to be relevant to differences in the waste and cash loss data.

Employee Engagement and Waste
The loss indicator waste, which relates to product that is dumped by the companies or the cost of reducing the price of products to encourage a sale prior to an expiry date being reached was found to be significantly related to a number of engagement factors – eight in total (23). The research found that together these eight factors accounted for 17.8% of the variance in levels of waste (Table 8).
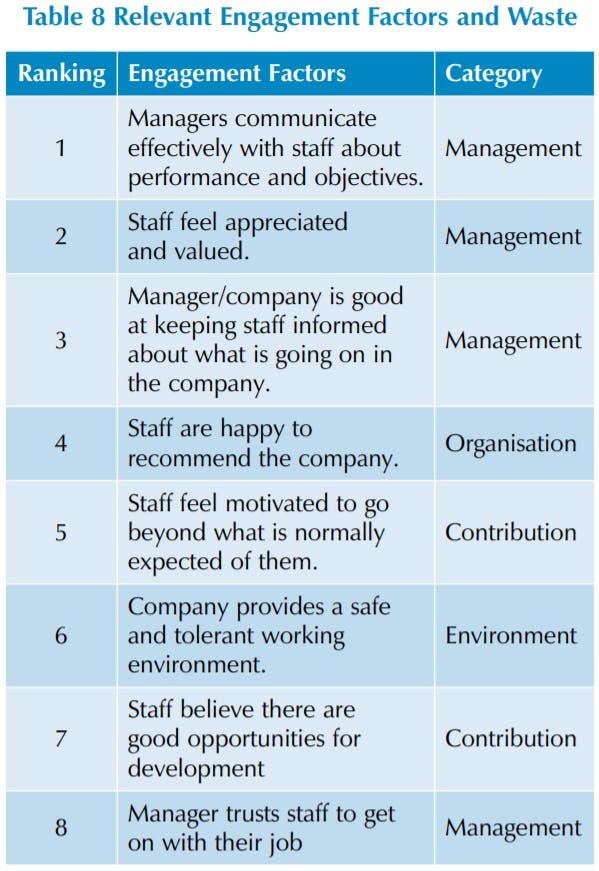
Of the engagement factors, the largest proportion came from the category of Management, and this was found to be the most impactful of all the categories highlighted in this area of loss. The most important was the extent to which managers effectively communicated with staff about their performance and objectives. This was then followed by how well staff felt they were appreciated and valued, and then the degree to which managers and the company kept staff informed about what was going on in the business.
The next most important factor was Organisational: the degree to which staff were happy to recommend the company to others, followed by the extent to which staff felt motivated to go beyond what is normally expected of them, how safe and tolerant the working environment is perceived to be and how much they felt there were opportunities for future development. The final engagement factor relevant to the waste indicator was the extent to which staff thought their manager trusted them to get on with their job.
As can be seen in Table 9 the bottom 25% of stores had an average rate of waste of 3.3% compared with 1.5% for the remaining 75% – more than double the rate. In financial terms it was estimated that waste is costing the European Grocery Sector €13.4 billion a year. If the bottom 25% of stores were able to improve on the eight employee engagement factors detailed in Table 8 and meet the average rate found in the remaining 75% of stores then this would lead to a potential saving in these stores of 9.8%. Overall this would lead to a potential saving of just over €200 million a year which equates to an overall reduction in waste of 1.5%.
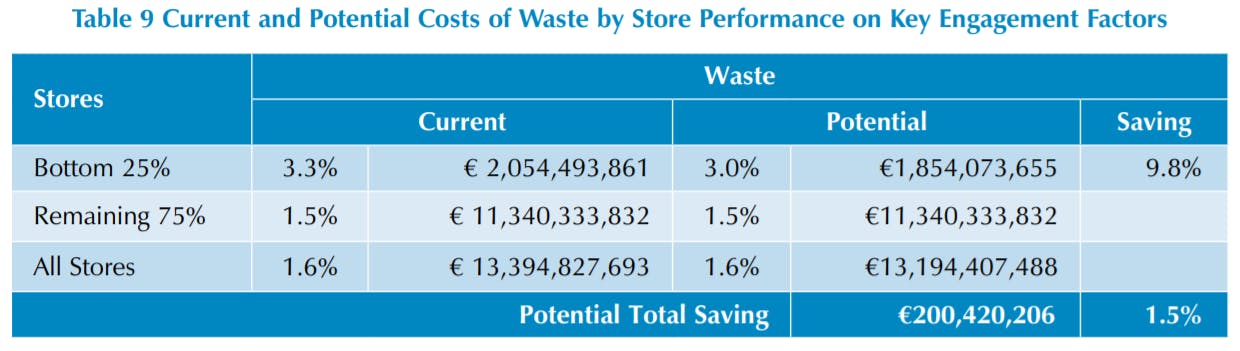
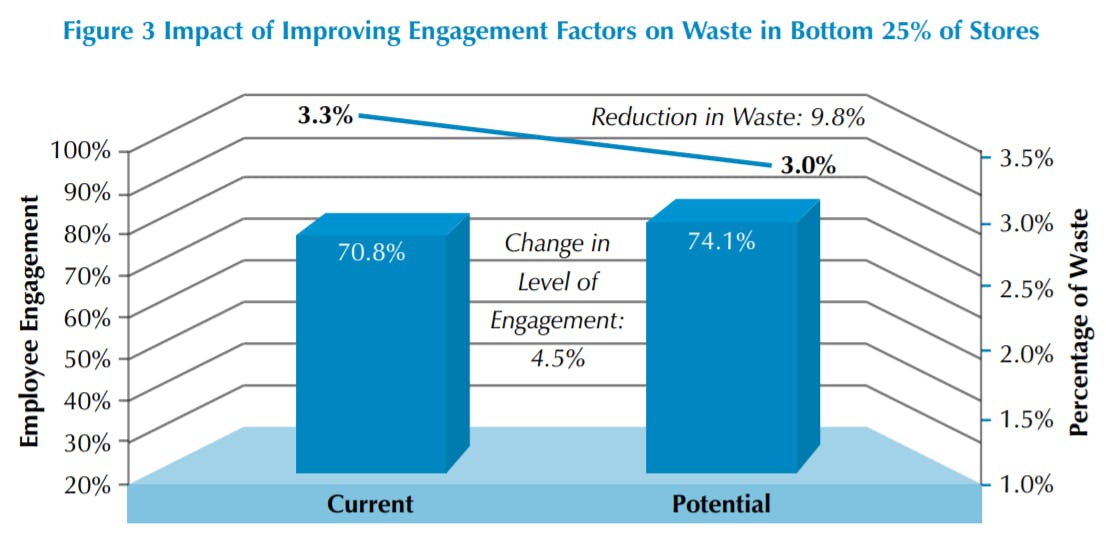
Figure 3 summarises the data on how improvements in these engagement factors can deliver considerable benefits to the European Grocery sector. As can be seen, it only requires a 4.5% uplift in the overall average score on the eight engagement factors (moving from an average of 70.8% to 74.1%) for the level of waste in these stores to potentially be reduced by 9.8%.
The effective management of waste in a grocery retailer is clearly a very important aspect of what the staff need focus upon and prioritise. Most retailers will recognise that well motivated staff are much more likely to handle this element of their work better – they are more likely to handle the product more carefully (leading to less damage as it moves through the supply chain), present the product better on the shelf (which is likely to increase product turnover), ensure that product nearing its end of shelf life is moved to the front of the shelf (reducing the amount of stock going out of date before it is sold), and better managing the discounting of goods reaching their sell by date (minimising the amount of stock having to be thrown away).

Employee Engagement and Out-of-Stocks
This report is one of the few times that an attempt has been made to try and calculate the cost of lost sales from out of stocks in a way which makes the data comparable with other forms of losses calculated by retail companies, in particular shrinkage, waste and cash losses. As detailed in the methodology section, only two of the three participating retailers were able to provide data on OOS and this was provided as an average percentage of the stock not available for sale at the time in which the measure was undertaken. Neither retailer was prepared to disclose precisely how this measure was calculated as it was considered sensitive commercial information. The reader should therefore exercise a degree of caution when interpreting the following statistics. Detailed in Table 10 are the five factors that were found to be negatively correlated with levels of OOS – as levels of OOS went down, the degree of engagement across these five factors went up.
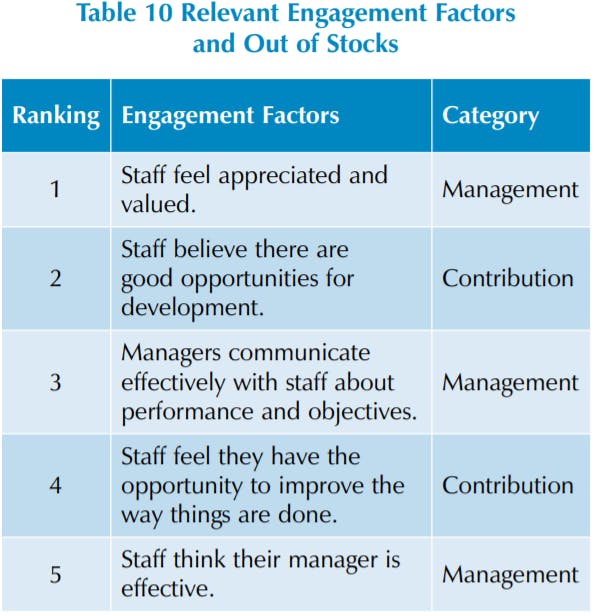
The most important factor was found to be the extent to which staff feel appreciated and valued by their managers followed by the degree to which they believe there are good opportunities for personal development. The third most important factor was how well staff felt their managers communicated with them relating to their performance and objectives followed by the extent to which they felt opportunities existed to improve the way things were done in the store. The final factor that was negatively correlated with rates of OOS was how effective staff thought their manager performed.
As can be seen, three of the five factors relate to the category of Management with the remaining two being associated with the category of Contribution.
Taken together, these five engagement factors were found to explain 42% of the variance in OOS – the highest explanatory value across all the forms of loss covered in this study.
The overall rate of lost sales due to OOS for the companies taking part in this study was estimated to be 0.8% of sales, with the bottom 25% of stores faring much worse with an overall rate of 1.3% compared with the remaining 75% which had an average of 0.7%. It was estimated that lost sales due to OOS is costing the European Grocery Sector over €6.3 billion a year. As can be seen in Table 11 if the bottom 25% of stores were able to improve their engagement scores to the average found in the other 75% of stores then they could achieve a saving of 19.6%, which equates to nearly €341 million a year. More broadly, such a modest level of improvement in employee engagement could reduce the overall cost of lost sales due to OOS by 5.4%, the highest rate found in this study

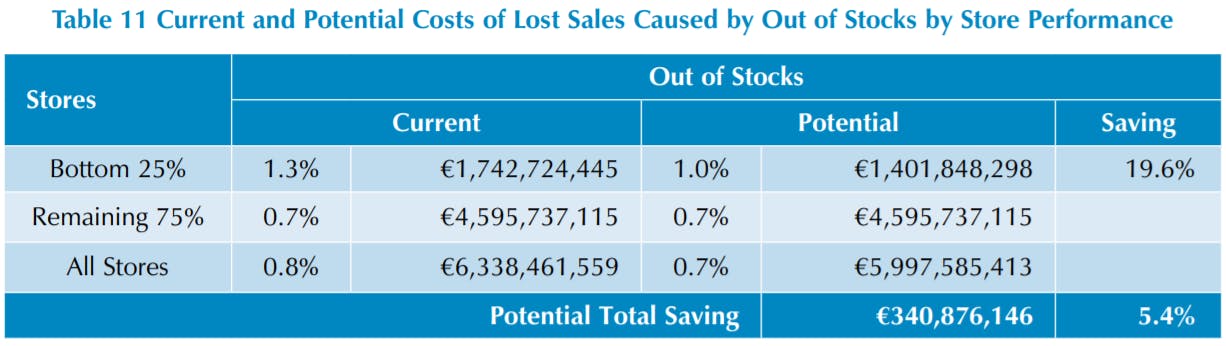
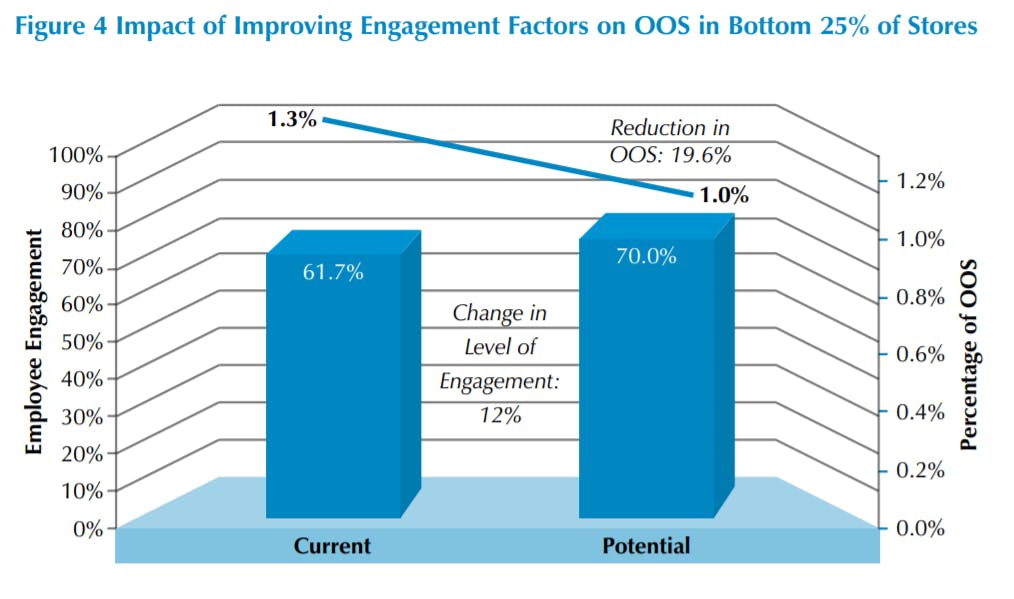
Figure 4 summarises the data on how improvements in these engagement factors can deliver considerable benefits to the European Grocery sector. As can be seen, it requires a 12% uplift in the overall average score on the five engagement factors (moving from an average of 61.7% to 70%) for the level of OOS in these stores to potentially be reduced by 19.6%.
As with the waste loss indicator, it is relatively straightforward to understand how an improvement in employee engagement can have an effect upon OOS. Staff who feel valued and positive about their role, their managers and the business for whom they work are much more likely to adhere to the processes and procedures designed to minimise OOS. They are more likely to identify and rectify gaps in product displays, restock more accurately, display product better on the shelf, apply product protection devices and equipment more consistently and sympathetically and so on.
Employee Engagement and Unknown Loss (Shrinkage)
The study found that four engagement factors (Table 12) were correlated with the available data on shrinkage from the three participating retailers and that their combined explanatory value was 19% – in other words, approximately one-fifth of the variance in the shrinkage rate could be explained by the four factors found to be negatively correlated with this loss indicator.
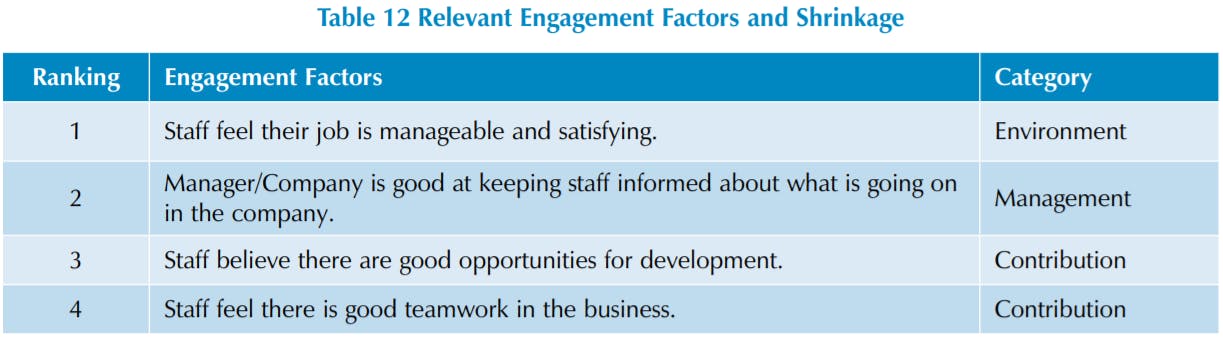
Of the engagement factors found to be related with shrinkage, the strongest correlation was with the extent to which staff thought that there job was manageable and satisfying followed by how well the manager and the company kept them informed about what is going on in the business. The other two factors related to the extent to which the staff believed there were opportunities for their development and whether they perceived that there was good teamwork in the company.
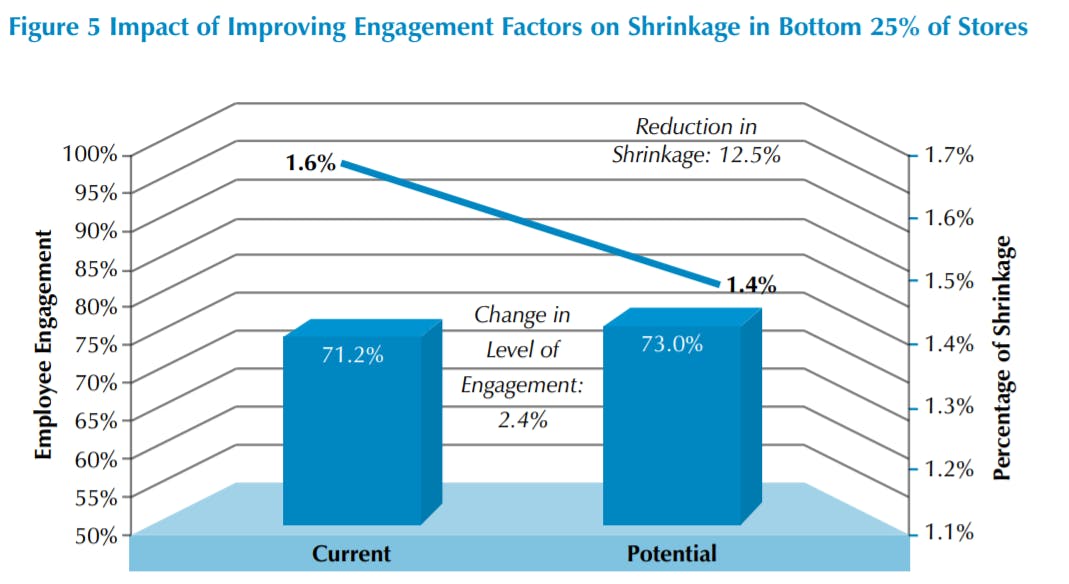
As can be seen in Table 13 the overall rate of shrinkage for the companies taking part in this study was 0.7%, equating to a potential loss for the European Grocery Sector of nearly €5.5 billion a year. However, there was a considerable difference in the rate of loss found in the bottom 25% of stores compared with the remaining 75%. For the former the rate was 1.6% whereas for the latter it was 0.5% – a threefold difference. Analysis showed that if the bottom 25% were to raise their employee engagement scores on the four factors detailed above to the average for the remaining 75% of stores, then the saving in shrinkage would be 12.5% in these stores, leading to an overall saving for the European Grocery Sector of just over €220 million a year – a 4.0% reduction overall in losses due to shrinkage.
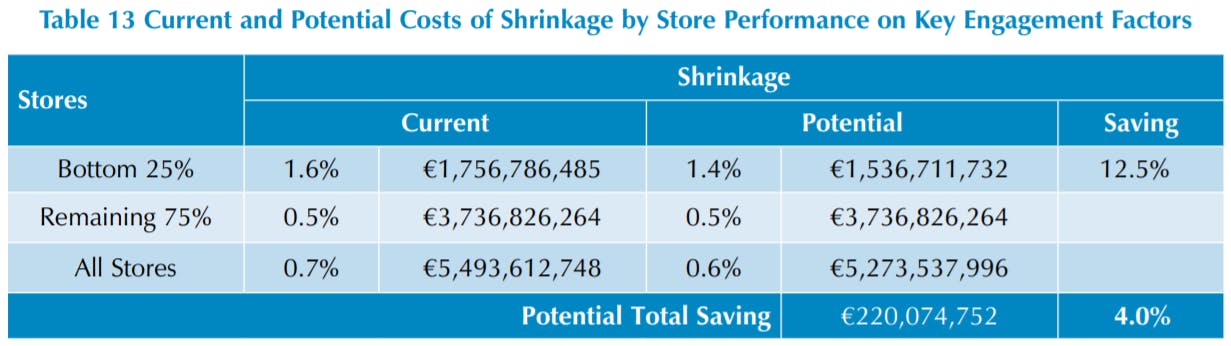
Figure 5 summarises the data on how improvements in these engagement factors can deliver considerable benefits to the European Grocery sector. As can be seen, it requires just a 2.4% uplift in the overall average score on the four engagement factors (moving from an average of 71.2% to 73%) for the level of shrinkage in these stores to potentially be reduced by 12.5%.
Typically the rate of shrinkage as a percentage of total sales is the most often used loss indicator by loss prevention departments to monitor the performance of stores despite the fact that it is arguably a rather unreliable statistic. This is because it is more often than not generated by annual audits that try and reconcile the difference between sales and book stocks, the difference often encapsulating a myriad of different causes including customer and staff theft, process errors and other losses of stock not recorded under other headings such as wastage and damage, all of which could have happened many months prior to being identified as a loss. In addition, stores can often be the unwitting recipients of shrinkage that occurred further down the supply chain such as in delivery or at distribution centres – losses can in effect be washed through into the store from elsewhere and only become apparent in the store because it is the point at which a measure is taken. The place of measurement is not always the same as the location in which the shrinkage happened. Given all of this, it is still apparent that levels of employee engagement can play a part in reducing rates of shrinkage – staff who feel demotivated, poorly rewarded and perceive few opportunities for future development are more likely to engage in deviant behaviour. Equally they may be less inclined to act as capable guardians of store products, perhaps not intervening when they see others (both customers and staff) carrying out acts of theft or damage. Research has shown the powerful affect attentive and engaged staff can have upon the likelihood of external thieves to think there is a higher risk of being caught. Given this, it is perhaps not surprising that the employee engagement factors identified above were found to be negatively correlated with overall rates of shrinkage – disaffected staff are not only more likely to steal but they are also less likely to intervene should others be tempted to engage in deviant activities.

Employee Engagement and Cash Loss
For the cash loss indicator data was only made available by two of the three companies taking part in this research and the overall level of loss was relatively small compared with the other loss indicators. As can be seen from Table 14 a total of 12 engagement factors were found to correlate with cash loss with Management again being the dominant category providing nearly 50% of the factors. Taken together, the 12 factors were able to explain 11.6% of the variance in levels of cash loss across the two retailers – the lowest across the four loss indicators used in this study.
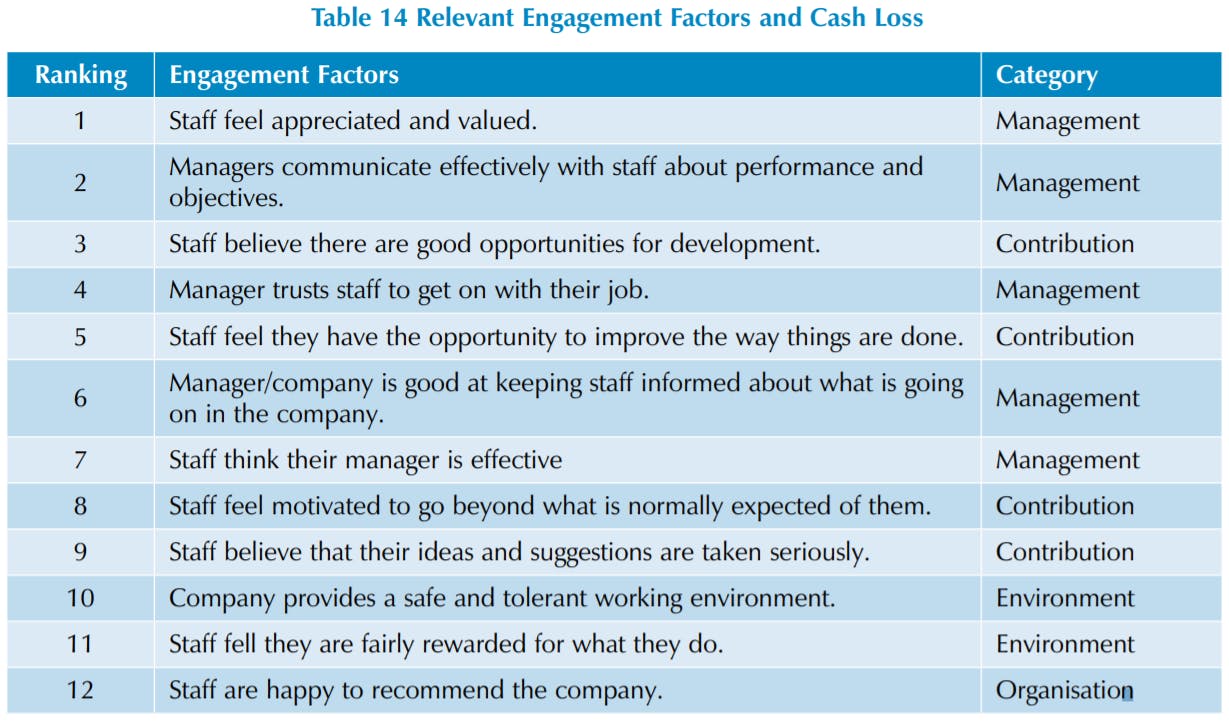
The factor with the most explanatory power was found to be the extent to which staff feel appreciated and valued, followed by whether managers communicate effectively and the presence of opportunities for development. These were then followed by a range of engagement factors covering how staff viewed their managers, both in terms of trusting them to do their job and how effective they (the manager) were to a number of contribution-based factors such as how motivated staff felt they were, whether their suggestions would be taken seriously and the type of environment within which they worked.
When looking at the cost of cash loss to the European Grocery Sector (Table 15), the numbers are modest compared with the other loss indicators presented in this report. However, what is interesting is that while the bottom 25% of stores account for just 18% of sales, they are responsible for 54% of all cash losses, with a rate of loss of 0.07% of sales. In contrast the remaining 75% of stores make up 82% of sales but only generate 46% of the cash losses, with an average rate of 0.01%. Given the regression model for the 12 satisfaction factors highlighted above suggested that 11.6% of the variance in rates of cash loss can be explained by them, this equates to a potential saving of 9.5% in the bottom 25% of stores if they were able to improve their scores to the average of the other stores in the sample. In monetary terms this comes to a saving for the European Grocery Sector of nearly €9.5 million or a reduction in the overall rate of 5.2%.
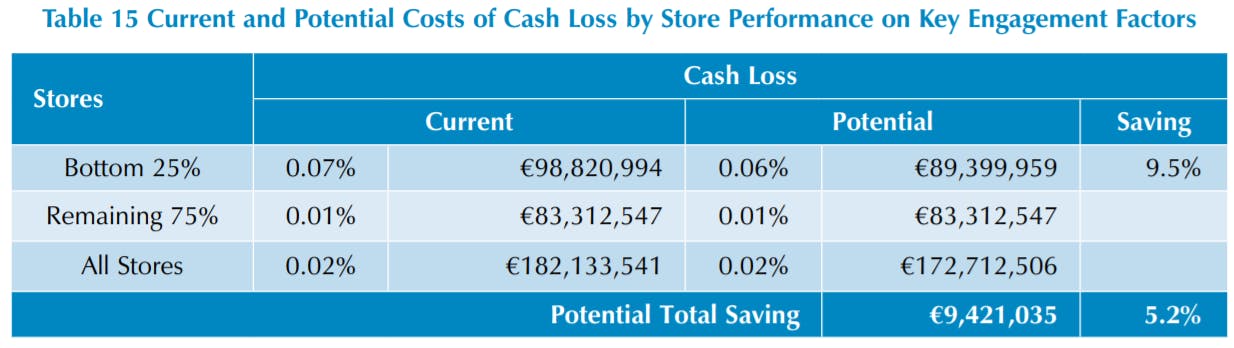
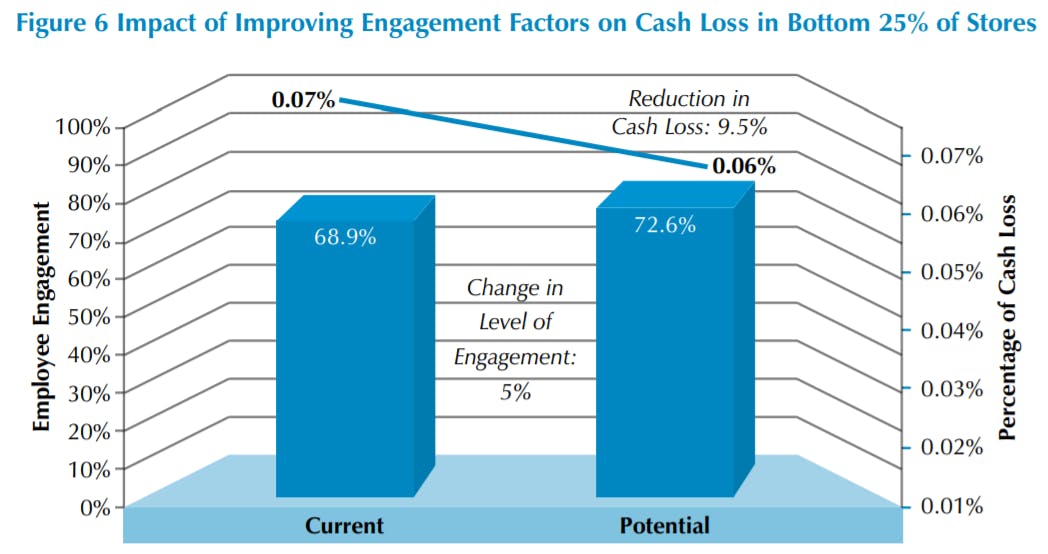
Figure 6 summarises the data on how improvements in these engagement factors relating to cash loss can deliver benefits to the European Grocery sector. As can be seen, it requires just a 5% uplift in the overall average score on the 12 engagement factors (moving from an average of 68.9% to 71.8%) for the level of cash loss to potentially be reduced by 9.5%.
In absolute terms, this is not a significant saving, and represents the loss indicator with the least potential for generating savings, but again, the data highlights how levels of engagement can impact upon a range of loss generators. How increased employee engagement can reduce cash losses is probably most evident at the checkout where employees are most likely to make errors in cash handling and potentially undertake malicious behaviour (stealing cash). Staff who feel appreciated and valued and perceive their workplace as one offering opportunity and a degree of personal fulfilment will be much less likely to generate error and engage in dishonest behaviour.

Loss Indicators and Store Performance
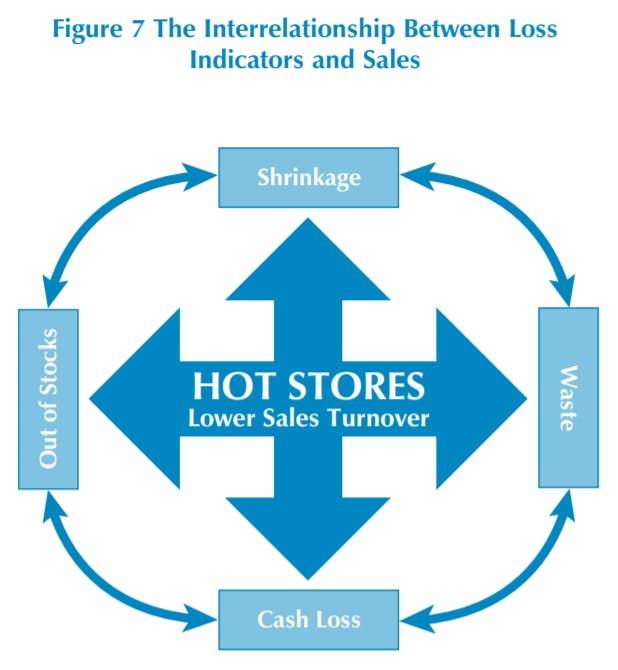
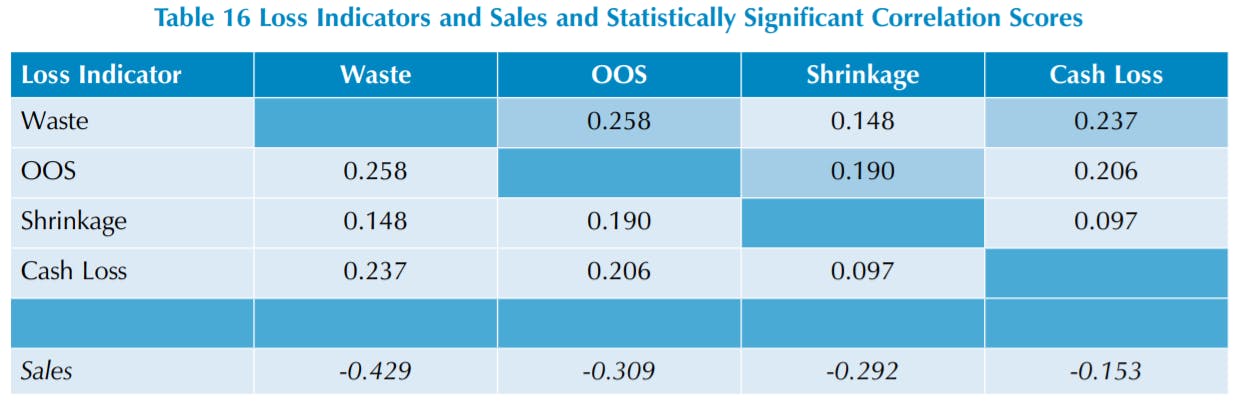
Anecdotal evidence has circulated around the world of Loss Prevention for many years that stores that perform badly (often described as ‘hot stores’) on a given loss indicator, typically shrinkage, are also likely to be poorly performing in other areas, including sales. The data provided by the three companies taking part in this study enabled the relationship between stores and the four loss indicators to be observed in some detail. It was found that all four loss indicators – waste, OOS, shrinkage and cash loss were positively correlated and that the relationship ranged from weak to modest amongst them all. As can be seen in Table 16 and Figure 7, waste was the loss indicator with the strongest correlation with the other three loss indicators.
In addition, all four loss indicators were negatively correlated with store sales – stores with lower sales typically have higher levels of all forms of loss.
This data would seem to suggest that long standing anecdotal stories about poorly performing stores is indeed correct – if for instance, a store has a poor shrinkage number, it is also likely to be performing badly on OOS, waste and cash loss. Indeed, the waste measure was found to be the most revealing statistic when it came to identifying stores that performed poorly on the other loss indicators. It was also the case that store turnover was negatively correlated with all the loss indicators, but especially waste.
Implications and Recommendations
Shrinkage in Context
This data has provided a fascinating insight into the role employee engagement might play on the levels of loss experienced by retailers. As detailed at the start of this report, much if not all previous research has focussed upon the potential impact retail employees might play in increasing business profitability through boosting sales, principally through better customer service models. What this report has done is look at the potential role employees might play in reducing one of the biggest drags on retail profitability – the losses they incur as they go about delivering their increasingly complex and ever more demanding retail value chains. As documented, for the three retailers taking part in this research, when the broad definition of total loss is applied then they are currently losing in the region of €1 billion a year, and if these companies are anything like representative of other grocers, then the total cost for Europe is in the region of €25 billion – more than the annual Gross Domestic Product of Lithuania!
The data has also been revealing in putting the cost and impact of the traditional loss indicator ‘shrinkage’ into a broader context of loss within a retail business. It has typically dominated not only how retail loss is defined but also how it is measured and valued. What this report has shown is that when compared with other forms of loss, in particular waste and the lost sales generated by out of stocks then it accounts for a relatively small proportion of all loss – approximately one-fifth of total losses (as defined in this report). This is not to undermine the impact shrinkage-related losses can have upon a retail business – far from it, the problems associated with customer and employee theft can be considerable and daunting to manage for many retailers. But the data does suggest that other areas of loss that are typically much more embedded within the day-to-day activities of the business and are frequently written off (often literally) as simply the cost of delivering retail profits have not only a profound impact upon retailers but also may have the potential to be reduced through better management and control.
Like many problems, it is often not until it is seen within a broader context that the full impact can be fully understood and recognised. Perhaps it is time for retailers to establish Out of Stocks and Waste Reduction Departments to accompany their existing Loss Prevention/Asset Protection Department – the data in this report would suggest that the size of the potential prize for the former two is dramatically bigger than that for the latter, in the region of €19 billion for European Grocers.
What this data has also shown is that there is enormous potential for changes in levels of employee engagement to impact upon these losses, and that this can be translated into improvements in profitability, possibly by as much as 20% in poorly performing stores. This report has adopted a purposefully conservative approach to estimating what changes in levels of employee engagement might mean – throughout the estimates for reducing losses have been based upon a modest scenario of improving rates of engagement in only the bottom performing 25% of stores to the average found in the remaining 75%. For example, in terms of the six engagement variables associated with total loss, the bottom 25% of stores would only need to improve their average by 7.9% to achieve the rate seen in the other 75% of stores, an improvement that could be worth €380 million to the European Grocery Sector.
Of the 18 potential engagement factors all but three were found to play some role in explaining variance in the four loss indicators. As detailed in Table 7, some factors were found to have greater explanatory power than others, with the role of management and how staff perceived their contribution to the business being particularly important and so it is worth reflecting upon what these results might mean for retail companies in particular for loss prevention professionals, management, human resources, employee training and communication within the organisation.
Loss Prevention and Employee Engagement
There is a general trend within the world of loss prevention to characterise the control of the problem of loss as one best done through the application of a range of technologies – Electronic Article Surveillance (EAS) tags, closed circuit cameras (CCTV), safer cases, Radio Frequency Identification (RFID) technologies and so on – the appliance of science to solve the challenges of retail loss. In some ways this is perfectly understandable, particularly when the definition for loss is mainly premised upon causes that are malicious in nature, such as theft by customers, which is one of the more difficult loss problems to tackle. But there is also a danger that Loss Prevention departments can become over-reliant on technology to prevent loss and forget the value of one of the retail organisation’s biggest assets and expenses: its employees. This could take the form of not only more informed training for those with management responsibilities but also the training provided to all staff operating throughout the organisation.
Based on the findings presented above, loss prevention professionals might want to think more about how they can focus some of their energy on ensuring employees in their organisation are more engaged with the business. Loss prevention professionals might want to take a keener interest in the results of future employee engagement surveys and utilise these results to target poorly performing aspects of the organisation that have an impact on a range of types of losses. In order to achieve this, it will be necessary for loss prevention managers and departments to communicate the importance of engaged employees to various other departments within the organisation. In addition, it will be necessary for loss prevention managers to guide these departments in their efforts to improve levels of engagement amongst employees by targeting specific aspects of loss in their organisation and the correlated aspects of engagement.
Pivotal Role of Managers
Throughout this report the role of managers, in particular the store manager has been a recurring theme – it was the category of engagement that had the greatest number of correlates with the four loss indicators. It is clear from this research, and indeed from other ECR studies, how important the store manager is in generating profit and controlling losses – they are the lightning rod through which the organisation’s culture, ethos, priorities and demands flow through to the fabric of the store, the behaviour of the staff and the way in which the customer consumes. They channel information, training, new developments and decisions from the broader organisation to store teams and often take critical decisions on how products will be displayed and protected. This research has shown that store managers can play an important role in generating higher levels of employee engagement, which in turn can produce lower levels of loss. Key elements include:
- Providing opportunities for staff development.
- Keeping staff informed about what is going on in the business.
- Communicating effectively with staff about their performance and objectives.
- Making staff feel appreciated and valued – a ‘thank you’ can go along way.
- Ensuring staff have manageable roles which they find satisfying.
- Building good teamwork.
- Soliciting ideas from staff and taking them seriously where appropriate.
Putting People First
Many of these factors are as much about personal behaviour and management style as they are about changing organisational structures, processes and procedures – it is perhaps one of the most profound elements of this research – the potential for significant savings through delivering a working environment where employees feel valued, encouraged, well informed and proud to be apart of the organisation. It does not require new technologies – it simply needs the business to recognise that not only are its people its greatest asset in terms of selling more, but they also can play a powerful role in helping the business to lose less, potentially a lot less!
Next Steps for Retailers
Give what has been presented in this report, detailed below are a range of potential next steps for those retailers interested in utilising the findings:
- Recognise the value of targetting employee engagement, especially in the bottom quartile of stores in their business.
- Review the selection process for store management and applicants’ capacity to deliver on employee engagement.
- Incorporate the results into training programmes for store managers – show them the value of improving employee engagement and how important their role is.
- Think about how the business communicates change to its employees – they want to know what is happening and why.
- Provide ways for staff to feed back ideas for improving the way the business operates (and if used, make sure they are recognised).
- Consider ways in which employees can be given opportunities for future development within the business.
- Reward good performance, even if it is only a ‘thank you’.
- Consider either utilising Employee Engagement surveys or reanalysing existing survey data to consider potential links between staff responses and a range of loss indicators – where possible do not just use the ‘shrinkage’ number as it is often a weak indicator of store performance on loss.
- Reflect upon how your business measures loss and whether current strategies and prioritises are targeting the most pressing areas of ‘loss’.
APPENDIX A
Underlying Questions and Composite Engagement Factors
- Staff and managers look to improve customer service
I understand why my work is important for clients.
Where I work customer orientation is a top priority.
My direct colleagues always act in the best interest of our customers.
My line manager takes actions to address customer needs and concerns.
My team regularly looks for ways to serve our customers better.
I regularly look for ways to serve our customers better. - All staff have the information, training, tools and equipment to do their job well.
I have the information I need to serve customers well.
Where I work, we are good at training new hires.
I have received the training I need to do my job well.
I have the tools and equipment I need to do my job well.
Where I work, we are good at training temporary staff.
I have everything I need to do my job well
I have the information I need to do my job well
I have access to the training I need to do more job effectively - Staff feel they are fairly rewarded for the work they do
I feel that I am paid fairly for what I do.
I feel that the pay I receive is fair for the work I do
I feel the benefits are fair and relevant to me
In comparison with people in similar jobs in other companies I feel my pay and benefits are reasonable - Staff feel appreciated and valued
I feel appreciated by my manager when I have done a good job.
I feel valued for the job I do
I get thanked for a job well done
I feel appreciated for the work I do
Praises me when I have done a good job - Staff believe that their ideas and suggestions are taken seriously.
My manager involves me in decisions that are important for my work
My manager takes my ideas and suggestions seriously.
My line manager listens to my ideas and suggestions
My manager listens to my ideas and involves me - Staff believe there are good opportunities for development
I think there are good development opportunities at Company X.
I learn things from my job at Company X.
I have the opportunity to progress at Company Y if I want to.
I am provides with training or development opportunities to help me build new skills.
There are opportunities for me to learn and develop within Company Z. - Staff are happy to recommend the company
I tell others great things about working at Company X.
I tell others great things about working here.
I tell people that Company Z is a good place to work. - Managers communicate effectively with staff about performance and objectives
I see and speak to my manager regularly
Communication flows both ways-My manager both talks and listens
My manager does a good job of explaining the reasons behind decisions and changes
My line manager speaks positively about and supports change
My line manager provides me with timely feedback that helps me improve my performance Feedback from the last XYZ survey was communicated to colleagues
Your Manager agrees clear performance objectives with me
Your Manager provides regular feedback on how I’m performing - Manager/Company is good at keeping us informed about what is going on in the company
My manager keeps me informed about what is important to me within Company X
Our huddles are an effective way to find out what is going on
I am kept informed about what Company Z is trying to achieve
My Manager makes time to keep me updated about Company Z’s performance, plans and direction - Manager trusts staff to get on with their job
My manager trusts me to do a good job
My line manager trusts me to get on with my job
Trusts me to get on with my job - Staff feel motivated to go beyond what is normally expected of them
I am motivated to go above and beyond what is normally expected for the store I work
I am motivated to go above and beyond what is normally expected to help Company X be successful
Company Y motivates me to do my best work everyday
My manager motivates me to deliver - Staff feel they are treated fairly and with respect
I feel fairly treated at work
Company Y puts high value on treating colleagues the right way
My manager treats me with respect - Staff feel they have the opportunity to improve the way things are done
Where I work, we regularly discuss how we can improve the way we do things.
I am encouraged to suggest new ways of doing things
The XYZ Group gives me the opportunity to put my views and ideas forward in my business area - Staff feel their job is manageable and satisfying.
I have enough time to do a quality job
I have enough variety in my work
I have enough opportunity to plan my own work
I can combine my work and private life
I have goals in my work that challenge me
I know what is expected of me in my job
I am happy with the balance between my work and home life
I know what I am expected to achieve in my job
I believe the amount of work I have to do is manageable
I am satisfied with my business area working - Staff feel there is good teamwork in the business
We work together in an easy and simple way
My direct colleagues do a good job
The different departments within Company X cooperate to get things done
There is good communication between the different parts of Company X (for example the (head) office / stores / logistics / production).
We work together to achieve our targets
I feel like I am a member of the team
Encourages our team to work well with other teams - Staff express loyalty towards the organisation
I would stay at Company X even if I would earn the same pay at a different company
I am proud to work at Company X [Brand Name] ambition and goals inspire me
I intend to be working for Company Y in 12months time
I have a strong sense of belonging to Company Y
We live the Company Y beliefs within my department
The success of Company Y is important to me
For me, working at Company Y is not just about the money
I would recommend Company Y as a great place to shop
I am proud to work for Company Y
On the whole, I believe Company Z is doing the right things to be successful
I am proud to recommend Company Z’s products
I intend to be working for Company Z in 12 months’ time - Company provides a safe and tolerant working environment
Company X respects and recognizes everyone’s’ contribution, no matter their background
Where I work safety is very important
We have a work environment that is open and accepts individual differences
At Company Y there is open and honest communication
I am comfortable voicing my concerns
Company Y provides safe and secure working conditions for all colleagues
Bullying is not tolerated in my workplace - Staff think their manager is effective.
My manager leads by example
My immediate manager does a good job of managing direct colleagues that perform poorly
My last appraisal has been done in an accurate way by my manager
My line manager holds colleagues accountable for results
My line manager is approachable and accessible
My manager makes effective, timely decisions
My manager helps me to be more effective in my job
My manager delivers on commitments
Footnotes
- Beck, A. with Peacock, P. (2009). New Loss Prevention: Redefining Shrinkage Management. Basingstoke: Palgrave Macmillan.
- Ibid.
- Ibid.
- Abelson, E. (1989). When Ladies Go A Thieving. New York: Oxford University Press; Bamfield, J. (2012). Shopping and Crime. Basingstoke: Palgrave Macmillan; Baumer, T. L., & Rosenbaum, D. P. (1984). Combatting Retail Theft: Programs and Strategies. Stoneham: Butterworth Publishers; and Sennewald, C. A., & Christman, J. H. (2008). Retail Crime, Security, and Loss Prevention: An Encyclopedic Reference. Burlington: Butterworth-Heinemann.
- See for instance: the Food Marketing Institute (2013) The Winds of Change: The 2013 Shrink Survey, http:// www.theshrinksurvey.com/, date accessed 10 November 2013; Hollinger, R. C., & Adams, A. (2011). 2010 National Retail Security Survey: Final Report. Gainsville, FL: University of Florida; and Bamfield, J. (2011). Global Retail Theft Barometer 2011. Nottingham: Centre for Retail Research.
- Sennewald and Christman op cit; Purpora, P. P. (1993). Retail Security and Shrinkage Protection. Stoneham: Butterworth-Heinemann.
- Chapman, P., & Templar, S. (2006a). Methods for Measuring Shrinkage. Security Journal, 19, 228-240.
- See for instance: Hayes, R. (2007). Retail Security and Loss Prevention. Basingstoke: Palgrave Macmillan.
- Grasso, S. (2003). 11th Annual Retail Crime Survey 2003. London: British Retail Consortium.
- Hollinger and Adams (2011), op cit; and Bamfield (2011), op cit.
- Beck (2009) op cit.
- Maxham, III, J.G., Netemeyer, R.G. and Lichtenstein, D.R. (2008) ‘The Retail Value Chain: Linking Employee Perceptions to Employee Performance, Customer Evaluations, and Store Performance’, Marketing Science, 27 (2): 147-167.
- Simon, D.H., Gomez, M.I., McLaughlin, E.W. and Wittink, D.R. (2009) ‘Employee Attitudes, Customer Satisfaction and Sales Performance: Assessing the Linkages in Us Grocery Stores’, Managerial and Decision Economics, 30: 27-41.
- Keiningham, T.L., Aksoy, L., Cooil, B., Peterson, K. and Vavra, T.G. (2006) ‘A longitudinal examination of the asymmetric impact of employee and customer satisfaction on retail sales’, Managing Service Quality, 16 (5): 442-459.
- Donnelly, JR, J.H. and Etzel, M.J. (1977) ‘Retail Store Performance and Job Satisfaction: A Study of Anxiety-Stress and Propensity to Leave Among Retail Employees’, Journal of Retailing, 53 (2): 23-28; Rich, G.A. (1997) ‘The Sales Manager as a Role Model: Effects on Trust, Job Satisfaction, and Performance of Salespeople’, Journal of the Academy of Marketing Science, 25 (4): 319-328.
- Murphy, K. R. (1993) Honesty in the Workplace, Brooks Cole: Pacific Grove, CA.
- See for instance Petty, McGee and Cavender (1984) A Meta-Analysis of the Relationship between Individual Job Satisfaction and Individual Performance; Laffaldano and Muchinsky (1985) Job Satisfaction and Job Performance: A Meta Analysis; and Bowling (2007) Is the Job satisfaction-job performance relationship spurious?
- Grocery is defined as all retailers which operate at least one of the following store formats: Agricultural supply stores, Bakeries, Butchers, Cash & carries, Confectioners, Convenience stores, Delicatessens, Delivered wholesale (Independent retailers), Department stores (with food hall), Discount stores, Discount superstores, Discount variety stores, Duty free stores, Food departments, Forecourt stores, Frozen food stores, Greengrocers, Grocery e-commerce, Grocery Vending Machines, Healthfood stores, Hypermarkets, Hypermarkets & superstores, Kiosks, Liquor/beverage stores, Mobile stores, Neighbourhood stores, Organic food stores, Pet shops, Petrol stations, Specialist food stores, Supermarkets, Supermarkets & Neighbourhood stores, Superstores, Variety stores (food), Warehouse clubs, Wholesale (other foods).
- The countries included in the definition of Europe are: Albania, Andorra, Armenia, Austria, Azerbaijan, Belarus, Belgium, Bosnia and Herzegovina, Bulgaria, Croatia, Cyprus, Czech Republic, Denmark, Estonia, Finland, France, Georgia, Germany, Greece, Hungary, Iceland, Ireland, Italy, Latvia, Lithuania, Luxembourg, Macedonia, Malta, Moldova, Monaco, Montenegro, Netherlands, Norway, Poland, Portugal, Romania, Russia, Serbia, Slovakia, Slovenia, Spain, Sweden, Switzerland, Ukraine, United Kingdom.
- Planet Retail. (2013). http://www.planetretail.net/, date accessed 10 December 2013.
- Corsten, D., & Gruen, T. (2002). Retail Out-of-Stocks: A Worldwide Examination of Extent, Causes and Consumer Responses, Washington: Grocery Manufacturers of America.
- http://www.ft.com/cms/s/0/2b6c9046-4c2b-11e1-b1b5-00144feabdc0.html#axzz2udkxsMn.
- As detailed in the methodology, one of the participating companies did not include product that had been dumped in their waste figure.


Main office
ECR Community a.s.b.l
Upcoming Meetings
Join Our Mailing List
Subscribe© 2023 ECR Retails Loss. All Rights Reserved|Privacy Policy